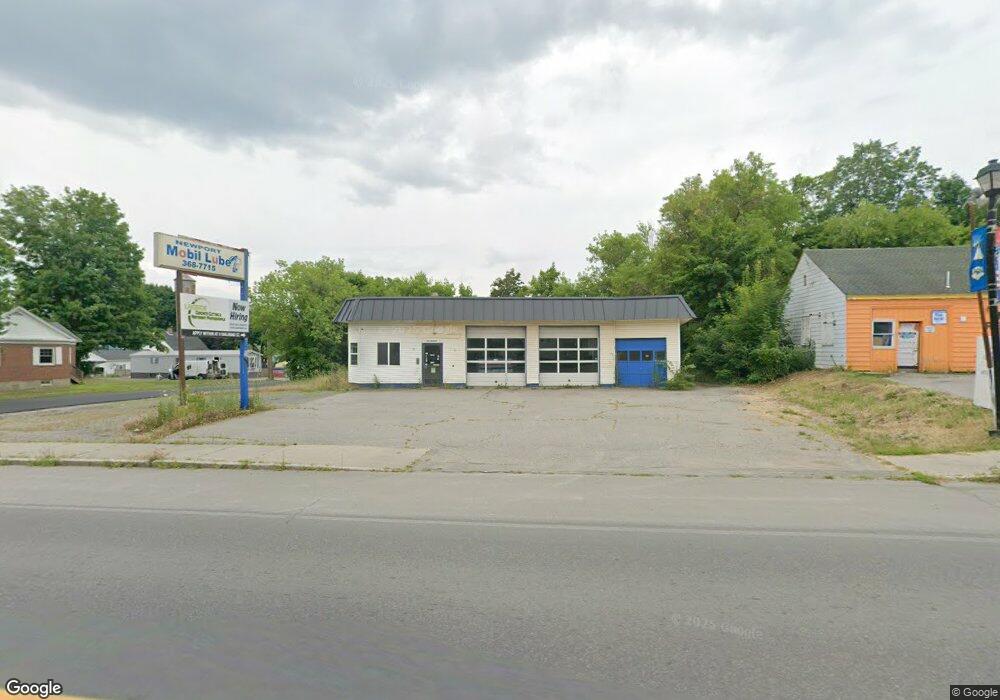
139 Main St Newport, ME 04953
Estimated Value: $180,196
--
Bed
--
Bath
1,573
Sq Ft
$115/Sq Ft
Est. Value
About This Home
This home is located at 139 Main St, Newport, ME 04953 and is currently estimated at $180,196, approximately $114 per square foot. 139 Main St is a home located in Penobscot County with nearby schools including Sebasticook Valley Elementary School and Nokomis Regional Middle School/High School.
Ownership History
Date
Name
Owned For
Owner Type
Purchase Details
Closed on
Sep 29, 2023
Sold by
Rizza Alexander
Bought by
Heritage Oak Re Llc
Current Estimated Value
Home Financials for this Owner
Home Financials are based on the most recent Mortgage that was taken out on this home.
Original Mortgage
$100,000
Outstanding Balance
$98,074
Interest Rate
7.23%
Mortgage Type
Purchase Money Mortgage
Estimated Equity
$82,122
Purchase Details
Closed on
Apr 1, 2021
Sold by
Rizza Realty Partners
Bought by
Rizza Alexander
Purchase Details
Closed on
Jan 5, 2012
Sold by
Motor Supply Co and Rizza Realty Partners
Bought by
Rizza Realty Partners
Create a Home Valuation Report for This Property
The Home Valuation Report is an in-depth analysis detailing your home's value as well as a comparison with similar homes in the area
Home Values in the Area
Average Home Value in this Area
Purchase History
| Date | Buyer | Sale Price | Title Company |
|---|---|---|---|
| Heritage Oak Re Llc | -- | None Available | |
| Rizza Alexander | -- | None Available | |
| Rizza Alexander | -- | None Available | |
| Rizza Realty Partners | -- | -- |
Source: Public Records
Mortgage History
| Date | Status | Borrower | Loan Amount |
|---|---|---|---|
| Open | Heritage Oak Re Llc | $100,000 |
Source: Public Records
Tax History Compared to Growth
Tax History
| Year | Tax Paid | Tax Assessment Tax Assessment Total Assessment is a certain percentage of the fair market value that is determined by local assessors to be the total taxable value of land and additions on the property. | Land | Improvement |
|---|---|---|---|---|
| 2024 | $1,757 | $100,400 | $35,700 | $64,700 |
| 2023 | $1,531 | $93,900 | $33,400 | $60,500 |
| 2022 | $1,454 | $74,200 | $26,400 | $47,800 |
| 2021 | $1,461 | $70,900 | $25,200 | $45,700 |
| 2020 | $1,432 | $69,500 | $24,700 | $44,800 |
| 2019 | $1,397 | $65,600 | $23,300 | $42,300 |
| 2018 | $1,397 | $65,600 | $23,300 | $42,300 |
| 2017 | $1,312 | $65,600 | $23,300 | $42,300 |
| 2016 | $1,273 | $65,600 | $23,300 | $42,300 |
| 2015 | $1,174 | $65,600 | $23,300 | $42,300 |
| 2014 | $1,128 | $65,600 | $23,300 | $42,300 |
Source: Public Records
Map
Nearby Homes
- 22 Shaw St
- 8 Grove St
- 49 North St
- 10 Sheridan St
- 16 Libby Hill Rd
- 107 Barrows Point Rd
- 20 Spruce St
- 448 Elm St
- 133 Hart St
- 6 Hurds Corner Rd
- 48 Hart St
- 315 Golf Course Rd
- lot 6 Golf Course Rd Unit Lot 6
- 5 North Rd
- 0000 Ridge Rd
- Lot 2 Golf Course Cameo Sub Rd
- 15 S Main St
- 14 Main St
- lot 5 Golf Course Cameo Sub Rd
- 85 Morse Rd