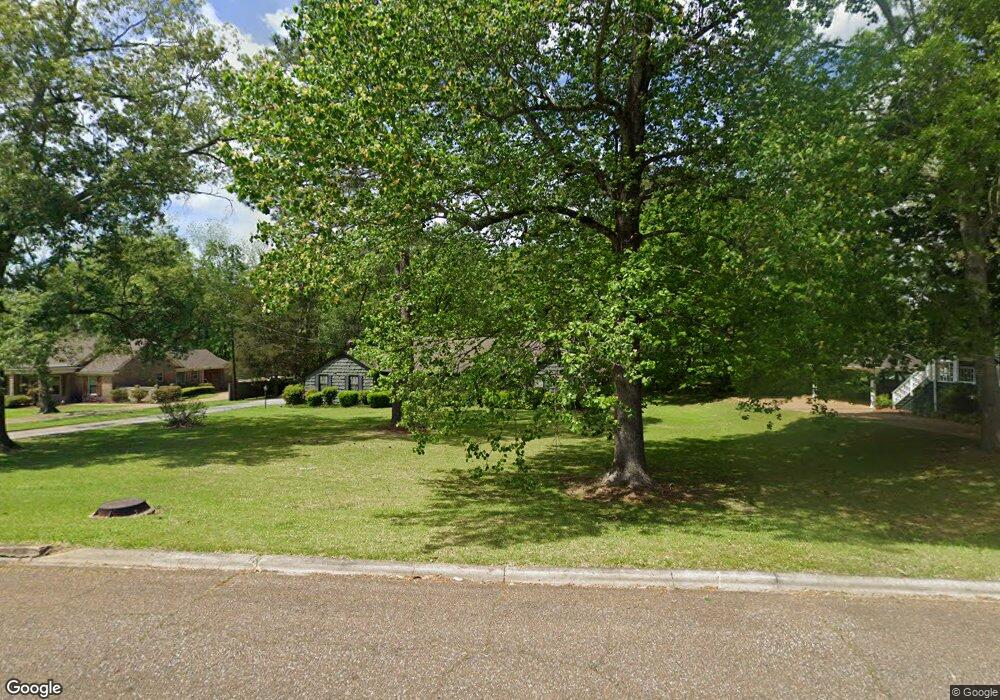
139 Mccord St West Point, MS 39773
Estimated Value: $196,000 - $245,000
3
Beds
--
Bath
2,485
Sq Ft
$87/Sq Ft
Est. Value
About This Home
This home is located at 139 Mccord St, West Point, MS 39773 and is currently estimated at $217,210, approximately $87 per square foot. 139 Mccord St is a home located in Clay County with nearby schools including East Side Elementary School, West Clay Elementary School, and Church Hill Elementary School.
Ownership History
Date
Name
Owned For
Owner Type
Purchase Details
Closed on
Oct 4, 2012
Sold by
Peeples Marilyn R and Robinson Richard Ray
Bought by
Mckellar Jason G and Mckellar Lucy C
Current Estimated Value
Home Financials for this Owner
Home Financials are based on the most recent Mortgage that was taken out on this home.
Original Mortgage
$157,140
Outstanding Balance
$107,928
Interest Rate
3.64%
Mortgage Type
New Conventional
Estimated Equity
$109,282
Create a Home Valuation Report for This Property
The Home Valuation Report is an in-depth analysis detailing your home's value as well as a comparison with similar homes in the area
Purchase History
| Date | Buyer | Sale Price | Title Company |
|---|---|---|---|
| Mckellar Jason G | -- | -- |
Source: Public Records
Mortgage History
| Date | Status | Borrower | Loan Amount |
|---|---|---|---|
| Open | Mckellar Jason G | $157,140 |
Source: Public Records
Tax History
| Year | Tax Paid | Tax Assessment Tax Assessment Total Assessment is a certain percentage of the fair market value that is determined by local assessors to be the total taxable value of land and additions on the property. | Land | Improvement |
|---|---|---|---|---|
| 2025 | $868 | $18,777 | $2,824 | $15,953 |
| 2024 | $868 | $18,777 | $2,824 | $15,953 |
| 2023 | $2,073 | $15,852 | $2,824 | $13,028 |
| 2022 | $714 | $15,852 | $2,824 | $13,028 |
| 2021 | $708 | $15,852 | $2,824 | $13,028 |
| 2020 | $712 | $15,852 | $2,824 | $13,028 |
| 2019 | $658 | $15,733 | $2,824 | $12,909 |
| 2018 | $630 | $15,733 | $2,824 | $12,909 |
| 2017 | $630 | $15,733 | $2,824 | $12,909 |
| 2016 | $613 | $15,733 | $2,824 | $12,909 |
| 2015 | $564 | $14,412 | $2,824 | $11,588 |
| 2014 | $335 | $14,412 | $2,824 | $11,588 |
| 2013 | $335 | $14,412 | $2,824 | $11,588 |
Source: Public Records
Map
Nearby Homes
- 913 E Westbrook St
- 27045 E Main St
- 26596 E Main St
- 341 Mccord St
- 551 E Westbrook St
- 228 Mccord St
- 480 E Westbrook St
- 26852 E Main St
- 105 Converse Dr
- 507 S Eshman Ave
- 26788 E Main St
- 761 E Morrow St
- 472 S Eshman Ave
- 278 Converse Dr
- 530 E Morrow St
- 238 Calhoun St
- 405 S Eshman Ave
- 1046 E Brame Ave
- 44 Torbert Dr
- 329 Converse Dr
- 545 Mccord St
- 27240 E Main St
- 204 Mccord St
- 556 Mccord St
- 1030 E Main St
- 134 Mccord St
- 1066 E Main St
- 1053 E Broad St
- 1042 E Main St
- 1357 E Broad St
- 1043 E Broad St
- 214 Mccord St
- 124 Mccord St
- 1022 E Main St
- 1333 E Broad St
- 1065 E Broad St
- 112 Mccord St
- 1012 E Main St
- 1121 E Jordan Avenue Extension
- 1105 E Broad St
Your Personal Tour Guide
Ask me questions while you tour the home.