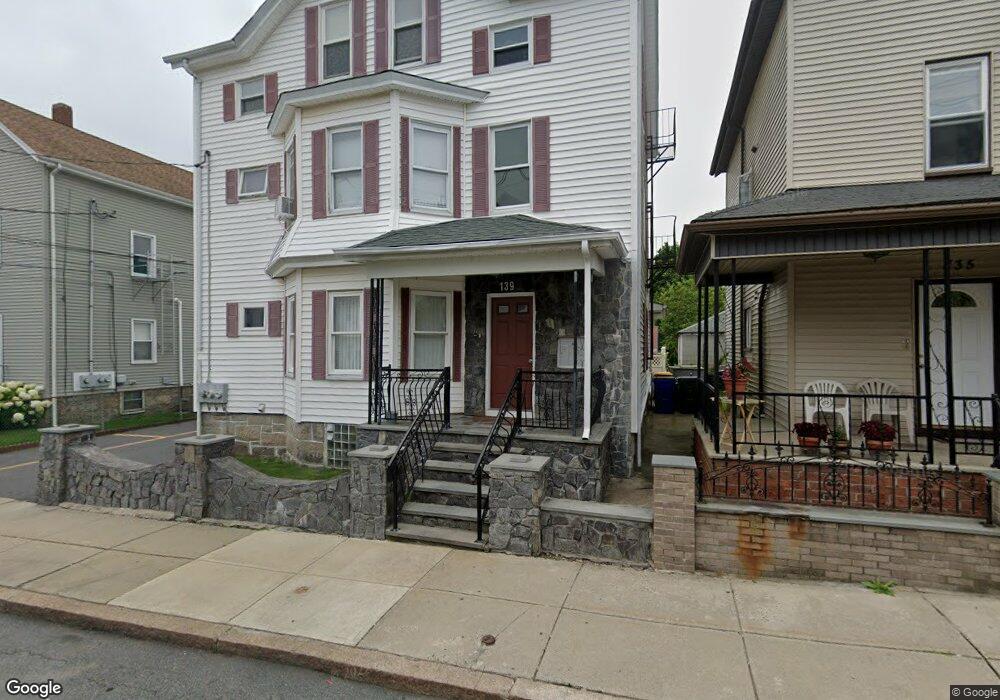
139 Mott St Fall River, MA 02721
Niagara NeighborhoodEstimated Value: $535,195 - $664,000
6
Beds
3
Baths
2,775
Sq Ft
$222/Sq Ft
Est. Value
About This Home
This home is located at 139 Mott St, Fall River, MA 02721 and is currently estimated at $617,049, approximately $222 per square foot. 139 Mott St is a home located in Bristol County with nearby schools including William S Greene, Matthew J. Kuss Middle School, and B M C Durfee High School.
Ownership History
Date
Name
Owned For
Owner Type
Purchase Details
Closed on
Apr 20, 2010
Sold by
Leite Joao and Leite Ana
Bought by
Raposo Michael and Raposo Jessica
Current Estimated Value
Home Financials for this Owner
Home Financials are based on the most recent Mortgage that was taken out on this home.
Original Mortgage
$230,743
Outstanding Balance
$153,454
Interest Rate
4.97%
Mortgage Type
Purchase Money Mortgage
Estimated Equity
$463,595
Purchase Details
Closed on
Jun 25, 1996
Sold by
Pimental Carlos and Pimental Anabela
Bought by
Leite Joao and Leite Ana
Create a Home Valuation Report for This Property
The Home Valuation Report is an in-depth analysis detailing your home's value as well as a comparison with similar homes in the area
Home Values in the Area
Average Home Value in this Area
Purchase History
| Date | Buyer | Sale Price | Title Company |
|---|---|---|---|
| Raposo Michael | $235,000 | -- | |
| Leite Joao | $135,000 | -- |
Source: Public Records
Mortgage History
| Date | Status | Borrower | Loan Amount |
|---|---|---|---|
| Open | Raposo Michael | $230,743 | |
| Previous Owner | Leite Joao | $131,000 | |
| Previous Owner | Leite Joao | $20,000 |
Source: Public Records
Tax History
| Year | Tax Paid | Tax Assessment Tax Assessment Total Assessment is a certain percentage of the fair market value that is determined by local assessors to be the total taxable value of land and additions on the property. | Land | Improvement |
|---|---|---|---|---|
| 2025 | $5,466 | $477,400 | $108,400 | $369,000 |
| 2024 | $5,234 | $455,500 | $104,400 | $351,100 |
| 2023 | $4,590 | $374,100 | $86,300 | $287,800 |
| 2022 | $4,096 | $324,600 | $82,100 | $242,500 |
| 2021 | $3,892 | $281,400 | $78,200 | $203,200 |
| 2020 | $3,519 | $243,500 | $77,000 | $166,500 |
| 2019 | $3,030 | $207,800 | $74,200 | $133,600 |
| 2018 | $2,934 | $200,700 | $80,300 | $120,400 |
| 2017 | $2,758 | $197,000 | $76,600 | $120,400 |
| 2016 | $2,714 | $199,100 | $81,500 | $117,600 |
| 2015 | $2,604 | $199,100 | $81,500 | $117,600 |
| 2014 | $2,608 | $207,300 | $79,100 | $128,200 |
Source: Public Records
Map
Nearby Homes
- 11 Foster St
- 304 Cambridge St
- 31 Niagara St
- 472 Buffinton St
- 405 Warren St
- 94 Snell St
- 231 Lapham St
- 766 Second St
- 355 Peckham St
- 472 Buffinton St (Ns)
- 364 Tecumseh St
- 132 Lonsdale St
- 658 Third St
- 654 Third St
- 188-194 Nashua St
- 582 Cambridge St
- 40 Duncan St
- 000 Lawrence St
- 1-11 Lawrence St
- 119 Pebble St
Your Personal Tour Guide
Ask me questions while you tour the home.