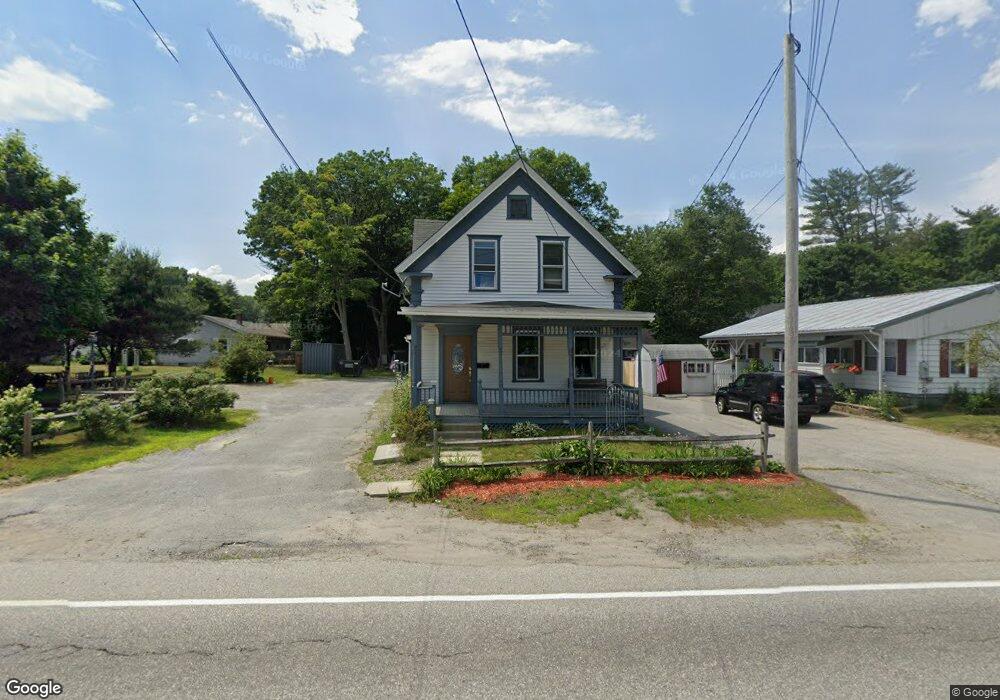
139 Mulberry St Claremont, NH 03743
South End NeighborhoodEstimated Value: $264,000 - $327,309
3
Beds
3
Baths
2,147
Sq Ft
$141/Sq Ft
Est. Value
About This Home
This home is located at 139 Mulberry St, Claremont, NH 03743 and is currently estimated at $302,327, approximately $140 per square foot. 139 Mulberry St is a home located in Sullivan County with nearby schools including Maple Avenue School, Claremont Middle School, and Stevens High School.
Ownership History
Date
Name
Owned For
Owner Type
Purchase Details
Closed on
Jul 25, 2012
Sold by
Bourdon John P
Bought by
Boutilier Patricia A
Current Estimated Value
Purchase Details
Closed on
Nov 14, 2008
Sold by
Deutsche Bank Natl T C
Bought by
Bourdon John P
Home Financials for this Owner
Home Financials are based on the most recent Mortgage that was taken out on this home.
Original Mortgage
$20,000
Interest Rate
6.11%
Mortgage Type
Unknown
Purchase Details
Closed on
Feb 12, 2008
Sold by
Ferland Brent E
Bought by
Deutsche Bank Natl T C
Purchase Details
Closed on
Mar 17, 2004
Sold by
Dickens Eleanor
Bought by
Ferland Bernard H and Ferland Rebecca H
Create a Home Valuation Report for This Property
The Home Valuation Report is an in-depth analysis detailing your home's value as well as a comparison with similar homes in the area
Home Values in the Area
Average Home Value in this Area
Purchase History
| Date | Buyer | Sale Price | Title Company |
|---|---|---|---|
| Boutilier Patricia A | $78,500 | -- | |
| Boutilier Patricia A | $78,500 | -- | |
| Bourdon John P | $62,500 | -- | |
| Deutsche Bank Natl T C | $118,400 | -- | |
| Deutsche Bank Natl T C | $118,400 | -- | |
| Ferland Bernard H | $85,000 | -- | |
| Ferland Bernard H | $85,000 | -- |
Source: Public Records
Mortgage History
| Date | Status | Borrower | Loan Amount |
|---|---|---|---|
| Previous Owner | Ferland Bernard H | $30,500 | |
| Previous Owner | Ferland Bernard H | $20,000 |
Source: Public Records
Tax History Compared to Growth
Tax History
| Year | Tax Paid | Tax Assessment Tax Assessment Total Assessment is a certain percentage of the fair market value that is determined by local assessors to be the total taxable value of land and additions on the property. | Land | Improvement |
|---|---|---|---|---|
| 2024 | $6,695 | $228,800 | $41,000 | $187,800 |
| 2023 | $6,361 | $228,800 | $41,000 | $187,800 |
| 2022 | $5,102 | $122,400 | $20,000 | $102,400 |
| 2021 | $5,016 | $122,400 | $20,000 | $102,400 |
| 2020 | $4,984 | $122,400 | $20,000 | $102,400 |
| 2019 | $4,928 | $122,400 | $20,000 | $102,400 |
| 2018 | $4,410 | $104,800 | $20,000 | $84,800 |
| 2017 | $4,471 | $104,800 | $20,000 | $84,800 |
| 2016 | $4,467 | $104,800 | $20,000 | $84,800 |
| 2015 | $4,346 | $104,800 | $20,000 | $84,800 |
| 2014 | $4,158 | $100,600 | $20,000 | $80,600 |
| 2013 | $5,619 | $155,000 | $21,600 | $133,400 |
Source: Public Records
Map
Nearby Homes