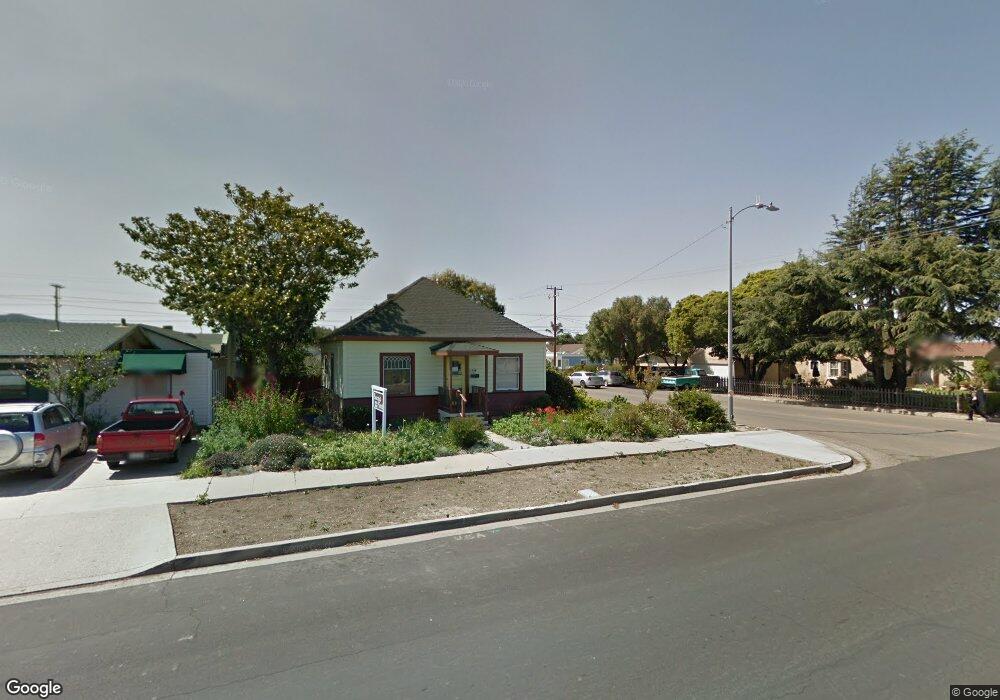
139 N D St Lompoc, CA 93436
Estimated Value: $437,000 - $473,000
2
Beds
1
Bath
890
Sq Ft
$518/Sq Ft
Est. Value
About This Home
This home is located at 139 N D St, Lompoc, CA 93436 and is currently estimated at $460,923, approximately $517 per square foot. 139 N D St is a home located in Santa Barbara County with nearby schools including Arthur Hapgood Elementary School, Lompoc Valley Middle School, and Lompoc High School.
Ownership History
Date
Name
Owned For
Owner Type
Purchase Details
Closed on
Jun 19, 2020
Sold by
Hartmann Carrie G and The Pace And Carrie Hartmann L
Bought by
Martinez James William and Martinez Brenda Marie
Current Estimated Value
Home Financials for this Owner
Home Financials are based on the most recent Mortgage that was taken out on this home.
Original Mortgage
$294,500
Outstanding Balance
$260,560
Interest Rate
3.1%
Mortgage Type
New Conventional
Estimated Equity
$200,363
Purchase Details
Closed on
Oct 21, 2005
Sold by
Goodcase Gail D
Bought by
Hartmann Pace R and Hartmann Carrie G
Home Financials for this Owner
Home Financials are based on the most recent Mortgage that was taken out on this home.
Original Mortgage
$214,000
Interest Rate
5.68%
Mortgage Type
Purchase Money Mortgage
Purchase Details
Closed on
Dec 19, 2002
Sold by
Hartmann Carrie G and Goodcase Carrie M
Bought by
Hartmann Pace R and Hartmann Carrie G
Create a Home Valuation Report for This Property
The Home Valuation Report is an in-depth analysis detailing your home's value as well as a comparison with similar homes in the area
Home Values in the Area
Average Home Value in this Area
Purchase History
| Date | Buyer | Sale Price | Title Company |
|---|---|---|---|
| Martinez James William | $310,000 | Fidelity National Title Co | |
| Hartmann Pace R | -- | -- | |
| Hartmann Pace R | -- | -- |
Source: Public Records
Mortgage History
| Date | Status | Borrower | Loan Amount |
|---|---|---|---|
| Open | Martinez James William | $294,500 | |
| Previous Owner | Hartmann Pace R | $214,000 |
Source: Public Records
Tax History
| Year | Tax Paid | Tax Assessment Tax Assessment Total Assessment is a certain percentage of the fair market value that is determined by local assessors to be the total taxable value of land and additions on the property. | Land | Improvement |
|---|---|---|---|---|
| 2025 | $3,591 | $335,551 | $129,890 | $205,661 |
| 2023 | $3,591 | $322,524 | $124,848 | $197,676 |
| 2022 | $3,526 | $316,200 | $122,400 | $193,800 |
| 2021 | $3,564 | $310,000 | $120,000 | $190,000 |
| 2020 | $1,788 | $150,109 | $90,067 | $60,042 |
| 2019 | $1,758 | $147,166 | $88,301 | $58,865 |
| 2018 | $1,731 | $144,281 | $86,570 | $57,711 |
| 2017 | $1,699 | $141,453 | $84,873 | $56,580 |
| 2016 | $1,668 | $138,680 | $83,209 | $55,471 |
| 2014 | $1,633 | $133,923 | $80,355 | $53,568 |
Source: Public Records
Map
Nearby Homes
Your Personal Tour Guide
Ask me questions while you tour the home.