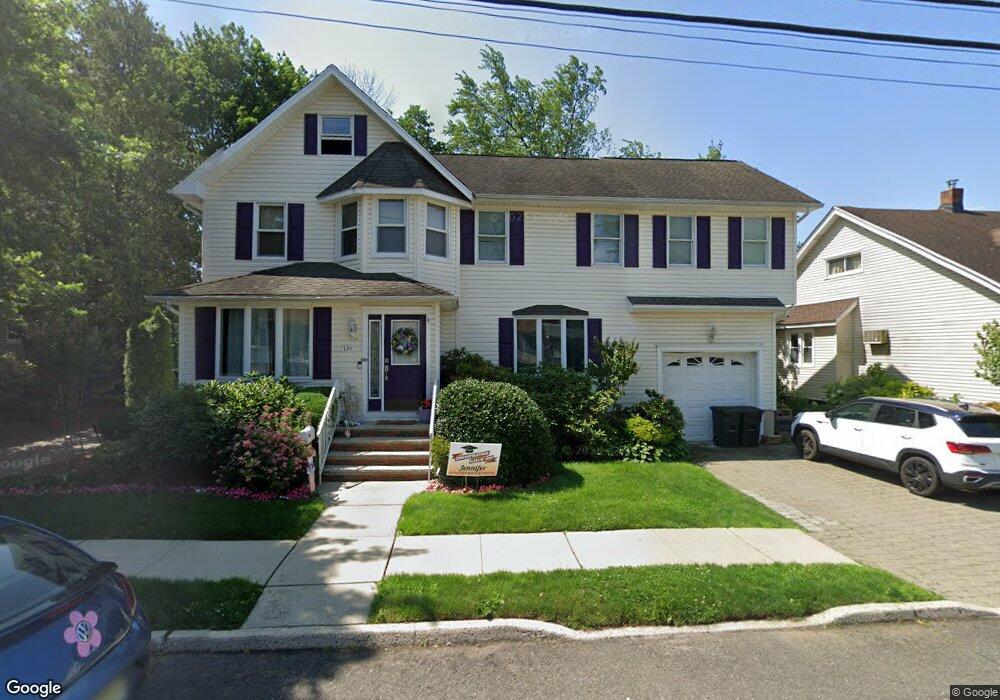
139 Niagara St Dumont, NJ 07628
Estimated Value: $555,000 - $761,000
--
Bed
--
Bath
2,160
Sq Ft
$307/Sq Ft
Est. Value
About This Home
This home is located at 139 Niagara St, Dumont, NJ 07628 and is currently estimated at $664,076, approximately $307 per square foot. 139 Niagara St is a home located in Bergen County with nearby schools including Dumont High School and Institute For Educational Achievement.
Ownership History
Date
Name
Owned For
Owner Type
Purchase Details
Closed on
Jun 15, 1999
Sold by
Sgarella John
Bought by
Sgarella John and Sgarella Kim
Current Estimated Value
Purchase Details
Closed on
Nov 17, 1995
Sold by
Dammeyer Helen
Bought by
Sgarella John
Home Financials for this Owner
Home Financials are based on the most recent Mortgage that was taken out on this home.
Original Mortgage
$102,000
Outstanding Balance
$1,395
Interest Rate
7.37%
Estimated Equity
$662,681
Create a Home Valuation Report for This Property
The Home Valuation Report is an in-depth analysis detailing your home's value as well as a comparison with similar homes in the area
Home Values in the Area
Average Home Value in this Area
Purchase History
| Date | Buyer | Sale Price | Title Company |
|---|---|---|---|
| Sgarella John | -- | -- | |
| Sgarella John | $132,500 | -- |
Source: Public Records
Mortgage History
| Date | Status | Borrower | Loan Amount |
|---|---|---|---|
| Open | Sgarella John | $102,000 |
Source: Public Records
Tax History Compared to Growth
Tax History
| Year | Tax Paid | Tax Assessment Tax Assessment Total Assessment is a certain percentage of the fair market value that is determined by local assessors to be the total taxable value of land and additions on the property. | Land | Improvement |
|---|---|---|---|---|
| 2025 | $13,967 | $685,800 | $311,100 | $374,700 |
| 2024 | $13,624 | $343,600 | $176,900 | $166,700 |
| 2023 | $13,342 | $343,600 | $176,900 | $166,700 |
| 2022 | $13,342 | $343,600 | $176,900 | $166,700 |
| 2021 | $13,265 | $343,600 | $176,900 | $166,700 |
| 2020 | $12,916 | $343,600 | $176,900 | $166,700 |
| 2019 | $12,607 | $343,600 | $176,900 | $166,700 |
| 2018 | $12,349 | $343,600 | $176,900 | $166,700 |
| 2017 | $11,280 | $320,000 | $176,900 | $143,100 |
| 2016 | $12,137 | $352,500 | $176,900 | $175,600 |
| 2015 | $11,858 | $352,500 | $176,900 | $175,600 |
| 2014 | $11,625 | $352,500 | $176,900 | $175,600 |
Source: Public Records
Map
Nearby Homes
- 62 Prospect Ave
- 32 1st St
- 122 W Quackenbush Ave
- 155 Johnson Ave
- 201 Dixon Ave
- 85 Dance Blvd
- 56 Sergent Ct
- 27A Park Ave
- 377 New Milford Ave
- 136 W Central Ave
- 5 Lawrence Ave
- 131 N Prospect Ave
- 190 Elder Ave
- 314 Hirschfeld Place
- 22 W Central Ave
- 19 Bedford Rd
- 9 New York Ave
- 507 James St
- 627 Concord St
- 18 Carlisle St
- 141 Niagara St
- 137 Niagara St
- 182 W Quackenbush Ave
- 143 Niagara St
- 190 W Quackenbush Ave
- 129 Niagara St
- 176 W Quackenbush Ave
- 196 W Quackenbush Ave
- 142 Niagara St
- 146 Niagara St
- 170 W Quackenbush Ave
- 138 Niagara St
- 150 Niagara St
- 123 Niagara St
- 198 W Quackenbush Ave
- 154 Niagara St
- 134 Niagara St
- 130 Niagara St
- 158 Niagara St
- 166 W Quackenbush Ave