139 Orchard Ave Battle Creek, MI 49017
Northeast Battle Creek NeighborhoodEstimated Value: $147,000 - $172,000
3
Beds
3
Baths
1,675
Sq Ft
$95/Sq Ft
Est. Value
About This Home
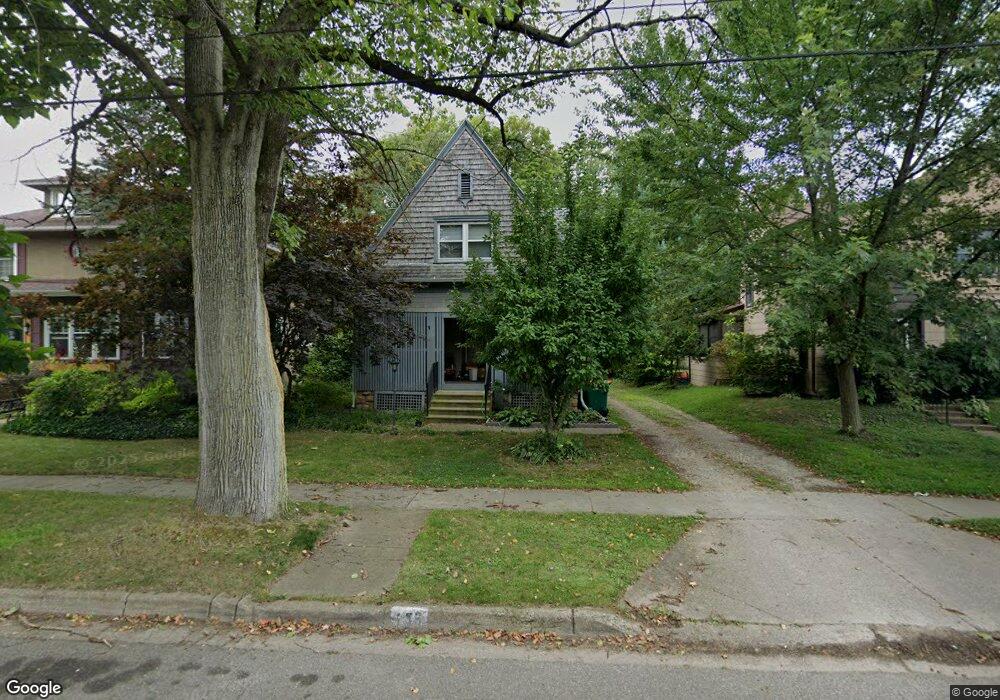
This home is located at 139 Orchard Ave, Battle Creek, MI 49017 and is currently estimated at $159,033, approximately $94 per square foot. 139 Orchard Ave is a home located in Calhoun County with nearby schools including Northwestern Middle School, Battle Creek Central High School, and St. Philip Catholic Central High School.
Ownership History
Date
Name
Owned For
Owner Type
Purchase Details
Closed on
May 31, 2012
Sold by
Dunham Roy W and Estate Of Louise M Dunham
Bought by
Poole Teresa L
Current Estimated Value
Home Financials for this Owner
Home Financials are based on the most recent Mortgage that was taken out on this home.
Original Mortgage
$41,300
Interest Rate
3.73%
Mortgage Type
New Conventional
Create a Home Valuation Report for This Property
The Home Valuation Report is an in-depth analysis detailing your home's value as well as a comparison with similar homes in the area
Home Values in the Area
Average Home Value in this Area
Purchase History
| Date | Buyer | Sale Price | Title Company |
|---|---|---|---|
| Poole Teresa L | -- | None Available |
Source: Public Records
Mortgage History
| Date | Status | Borrower | Loan Amount |
|---|---|---|---|
| Previous Owner | Poole Teresa L | $41,300 |
Source: Public Records
Tax History Compared to Growth
Tax History
| Year | Tax Paid | Tax Assessment Tax Assessment Total Assessment is a certain percentage of the fair market value that is determined by local assessors to be the total taxable value of land and additions on the property. | Land | Improvement |
|---|---|---|---|---|
| 2025 | -- | $62,300 | $0 | $0 |
| 2024 | $1,242 | $60,557 | $0 | $0 |
| 2023 | $1,419 | $51,240 | $0 | $0 |
| 2022 | $1,122 | $47,266 | $0 | $0 |
| 2021 | $1,339 | $45,397 | $0 | $0 |
| 2020 | $1,260 | $39,797 | $0 | $0 |
| 2019 | $1,255 | $40,126 | $0 | $0 |
| 2018 | $1,255 | $33,151 | $1,300 | $31,851 |
| 2017 | $1,216 | $32,447 | $0 | $0 |
| 2016 | $1,214 | $27,816 | $0 | $0 |
| 2015 | $1,231 | $26,220 | $2,293 | $23,927 |
| 2014 | $1,231 | $26,705 | $2,293 | $24,412 |
Source: Public Records
Map
Nearby Homes
- 162 Orchard Ave
- 91 Sherman Rd
- 14 Elizabeth St
- 170 Sherman Rd
- 105 Chestnut St
- 195 Union St N
- 176 Union St N
- 261 Emmett St E
- 19 Central St
- 31 Orchard Place
- 78 Central St
- 45 Central St
- 25 Orchard Place
- 192 Fremont St
- 114 Fremont St
- 323 Garfield Ave
- 21 Bryant St
- 90 N Broad St
- 124 Broad St N
- 162 Calhoun St