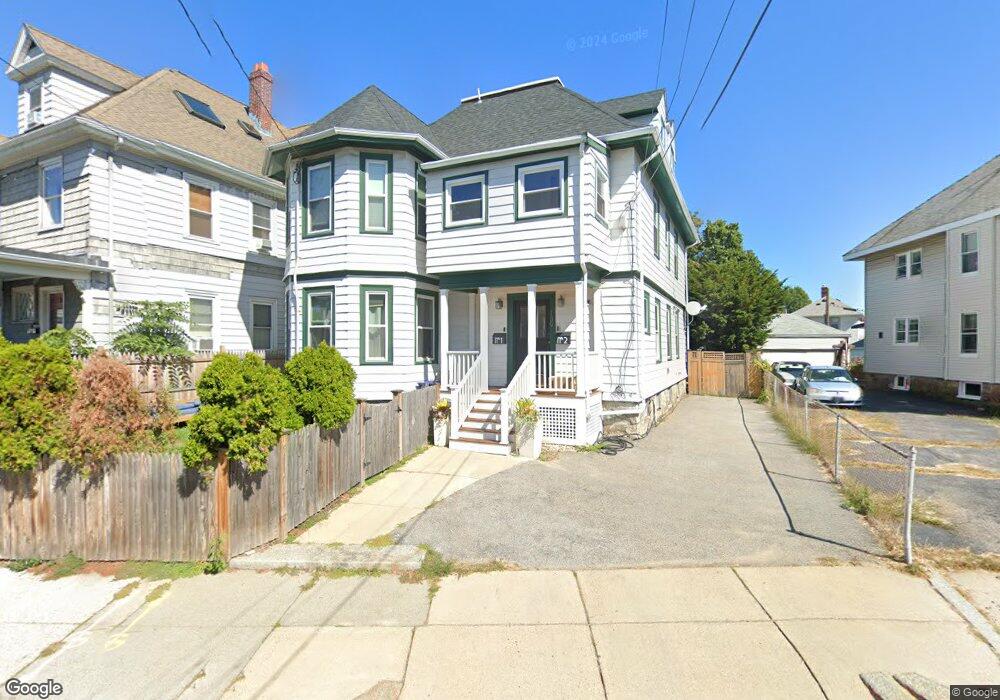
139 Parsons St Unit 1 Brighton, MA 02135
Brighton NeighborhoodEstimated Value: $565,000 - $630,000
2
Beds
1
Bath
1,078
Sq Ft
$551/Sq Ft
Est. Value
About This Home
This home is located at 139 Parsons St Unit 1, Brighton, MA 02135 and is currently estimated at $594,166, approximately $551 per square foot. 139 Parsons St Unit 1 is a home located in Suffolk County with nearby schools including Boston Green Academy Horace Mann Charter School, St Columbkille Partnership School, and Shaloh House Jewish Day School.
Ownership History
Date
Name
Owned For
Owner Type
Purchase Details
Closed on
Sep 16, 2016
Sold by
Aviat Waltzing Matilda
Bought by
Daneau Timothy J
Current Estimated Value
Home Financials for this Owner
Home Financials are based on the most recent Mortgage that was taken out on this home.
Original Mortgage
$280,000
Outstanding Balance
$223,653
Interest Rate
3.43%
Mortgage Type
New Conventional
Estimated Equity
$370,513
Purchase Details
Closed on
Feb 14, 2012
Sold by
Manning Christina
Bought by
Waltzing Matilda Aviat
Purchase Details
Closed on
May 26, 2011
Sold by
Fhlmc
Bought by
Manning Christina
Purchase Details
Closed on
May 3, 2011
Sold by
Ocwen Loan Servicing L
Bought by
Fhlmc
Purchase Details
Closed on
Dec 5, 2005
Sold by
Burke Aidan
Bought by
Bordeu Michelle
Home Financials for this Owner
Home Financials are based on the most recent Mortgage that was taken out on this home.
Original Mortgage
$265,000
Interest Rate
6.14%
Mortgage Type
Purchase Money Mortgage
Create a Home Valuation Report for This Property
The Home Valuation Report is an in-depth analysis detailing your home's value as well as a comparison with similar homes in the area
Home Values in the Area
Average Home Value in this Area
Purchase History
| Date | Buyer | Sale Price | Title Company |
|---|---|---|---|
| Daneau Timothy J | $330,000 | -- | |
| Waltzing Matilda Aviat | $261,000 | -- | |
| Manning Christina | $261,000 | -- | |
| Fhlmc | $220,150 | -- | |
| Bordeu Michelle | $350,500 | -- |
Source: Public Records
Mortgage History
| Date | Status | Borrower | Loan Amount |
|---|---|---|---|
| Open | Daneau Timothy J | $280,000 | |
| Previous Owner | Bordeu Michelle | $265,000 |
Source: Public Records
Tax History Compared to Growth
Tax History
| Year | Tax Paid | Tax Assessment Tax Assessment Total Assessment is a certain percentage of the fair market value that is determined by local assessors to be the total taxable value of land and additions on the property. | Land | Improvement |
|---|---|---|---|---|
| 2025 | $5,929 | $512,000 | $0 | $512,000 |
| 2024 | $5,369 | $492,600 | $0 | $492,600 |
| 2023 | $5,291 | $492,600 | $0 | $492,600 |
| 2022 | $5,105 | $469,200 | $0 | $469,200 |
| 2021 | $4,908 | $460,000 | $0 | $460,000 |
| 2020 | $5,001 | $473,600 | $0 | $473,600 |
| 2019 | $4,802 | $455,600 | $0 | $455,600 |
| 2018 | $4,569 | $436,000 | $0 | $436,000 |
| 2017 | $4,275 | $403,700 | $0 | $403,700 |
| 2016 | $4,228 | $384,400 | $0 | $384,400 |
| 2015 | $4,133 | $341,300 | $0 | $341,300 |
| 2014 | $3,900 | $310,000 | $0 | $310,000 |
Source: Public Records
Map
Nearby Homes
- 6 Harriet St
- 11 Faneuil St
- 77 Bennett St Unit 2
- 59 Riverview Rd
- 212 Market St Unit 201
- 83-85 Surrey St
- 200-202 Market St
- 18 Glencoe St Unit 42
- 87 Etna St
- 71 Brooks St
- 84-86 Etna St
- 10 Waldo Terrace
- 461 Washington St Unit 301
- 70 Leo Birmingham Pkwy Unit 307
- 30 Dighton St Unit 3
- 30 Dighton St
- 21 Upcrest Rd
- 58 Dustin St Unit 1
- 50 Leo M Birmingham Pkwy Unit 605
- 50 Leo M Birmingham Pkwy Unit 303
- 139 Parsons St Unit 2
- 135 Parsons St
- 135 Parsons St Unit 1
- 145 Parsons St Unit 1
- 143-145 Parsons St Unit 145
- 143-145 Parsons St
- 143 Parsons St Unit 145
- 143 Parsons St Unit 2
- 5 Niles St
- 129 Parsons St
- 129 Parsons St
- 129 Parsons St Unit 2
- 130 Parsons St
- 130 Parsons St Unit 1
- 7 Niles St
- 134 Parsons St Unit 2
- 134 Parsons St
- 134 Parsons St Unit 1
- 134 Parsons St
- 128 Parsons St