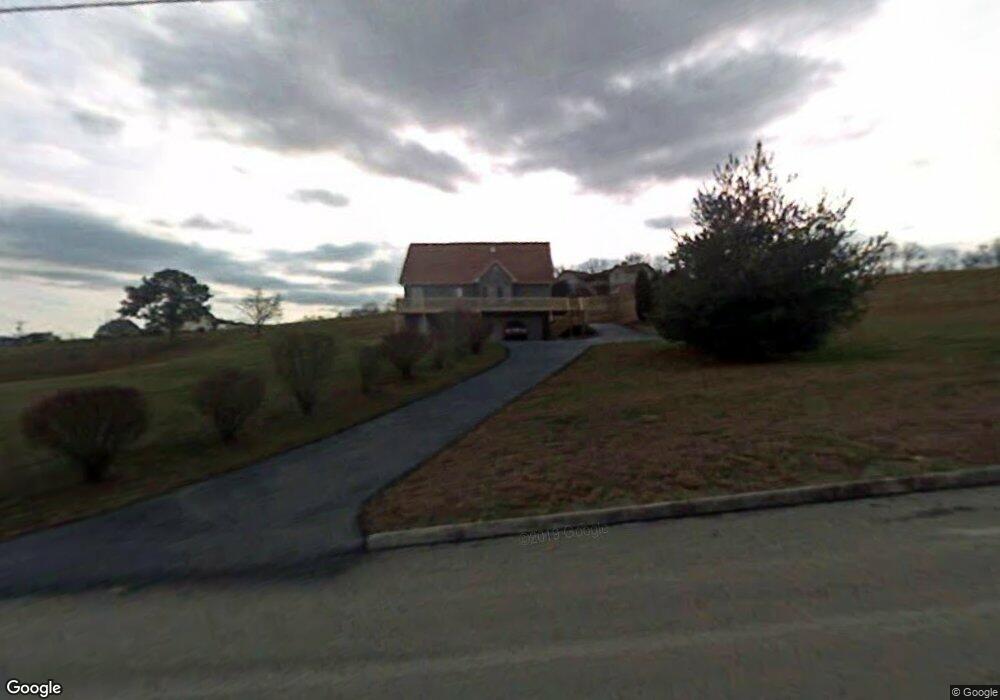
139 Pheasant View Rutledge, TN 37861
Estimated Value: $510,000 - $593,000
4
Beds
3
Baths
3,344
Sq Ft
$166/Sq Ft
Est. Value
About This Home
This home is located at 139 Pheasant View, Rutledge, TN 37861 and is currently estimated at $553,936, approximately $165 per square foot. 139 Pheasant View is a home located in Grainger County with nearby schools including Rutledge Primary School, Rutledge Elementary School, and Rutledge Middle School.
Ownership History
Date
Name
Owned For
Owner Type
Purchase Details
Closed on
Aug 18, 2023
Sold by
Potvin Natasha
Bought by
Greco Jeffrey D and Greco Melissa
Current Estimated Value
Home Financials for this Owner
Home Financials are based on the most recent Mortgage that was taken out on this home.
Original Mortgage
$416,600
Outstanding Balance
$406,699
Interest Rate
6.81%
Mortgage Type
New Conventional
Estimated Equity
$147,237
Purchase Details
Closed on
Oct 20, 2008
Sold by
Vincent Jay M
Bought by
Potvin Natasha
Home Financials for this Owner
Home Financials are based on the most recent Mortgage that was taken out on this home.
Original Mortgage
$274,438
Interest Rate
5.78%
Mortgage Type
FHA
Purchase Details
Closed on
Oct 18, 2006
Bought by
Vincent Jay M
Purchase Details
Closed on
Nov 15, 1995
Bought by
Breece Charles
Purchase Details
Closed on
Aug 19, 1991
Bought by
Bunch Don
Create a Home Valuation Report for This Property
The Home Valuation Report is an in-depth analysis detailing your home's value as well as a comparison with similar homes in the area
Purchase History
| Date | Buyer | Sale Price | Title Company |
|---|---|---|---|
| Greco Jeffrey D | $466,600 | Concord Title | |
| Potvin Natasha | $290,000 | -- | |
| Vincent Jay M | $258,900 | -- | |
| Breece Charles | $15,500 | -- | |
| Bunch Don | $625,000 | -- |
Source: Public Records
Mortgage History
| Date | Status | Borrower | Loan Amount |
|---|---|---|---|
| Open | Greco Jeffrey D | $416,600 | |
| Previous Owner | Bunch Don | $274,438 |
Source: Public Records
Tax History
| Year | Tax Paid | Tax Assessment Tax Assessment Total Assessment is a certain percentage of the fair market value that is determined by local assessors to be the total taxable value of land and additions on the property. | Land | Improvement |
|---|---|---|---|---|
| 2025 | $1,521 | $64,725 | $12,675 | $52,050 |
| 2024 | $1,521 | $64,725 | $12,675 | $52,050 |
| 2023 | $1,521 | $64,725 | $12,675 | $52,050 |
| 2022 | $1,486 | $64,725 | $12,675 | $52,050 |
| 2021 | $1,486 | $64,725 | $12,675 | $52,050 |
| 2020 | $1,551 | $64,725 | $12,675 | $52,050 |
| 2019 | $1,551 | $55,375 | $10,625 | $44,750 |
| 2018 | $1,340 | $55,375 | $10,625 | $44,750 |
| 2017 | $1,340 | $55,375 | $10,625 | $44,750 |
| 2016 | $1,340 | $55,375 | $10,625 | $44,750 |
| 2015 | $1,436 | $55,375 | $10,625 | $44,750 |
| 2014 | $1,436 | $57,438 | $0 | $0 |
Source: Public Records
Map
Nearby Homes
- 0 Mallard Baye Unit 1318923
- Lot 60 Mallard Baye
- 355 Pheasant View
- 153 Washita Ln
- 440 Pheasant View
- Lot 199 Woodstock Dr
- Lot 180 Woodstock Dr
- Lot 209 Woodstock Dr
- 133 Washita Ln
- 284 Woodstock Dr
- 211 Washita Ln
- 213 Washita Ln
- Lot 2 Baye Rd
- 199 Chippewa Ln
- 235 Chippewa Ln
- 413 Chippewa Ln
- Lot 6 Peninsula Pointe
- Lot 7 Peninsula Pointe
- Lot 2 Peninsula Pointe
- Lot 4 Peninsula Pointe
- 139 Pheasant View
- 187 Pheasant View
- 195 Pheasant View
- 188 Pheasant View
- 186 Pheasant View
- 193 Pheasant View
- 0 Pheasant View Lot 195 Unit 1111686
- 193 Pheasant View
- 255 Pheasant View Unit S/D Mallard Baye
- 255 Pheasant View
- 235 Pheasant View
- 494 Mallard Baye
- 530 Mallard Baye
- 532 Mallard Baye
- Lot 168 Pheasant View
- 0 Pheasant View Unit 1246189
- Lot 192 Pheasant View
- Lot 185 Pheasant View
- Lot 187 Pheasant View
- Lot 195 Pheasant View
Your Personal Tour Guide
Ask me questions while you tour the home.