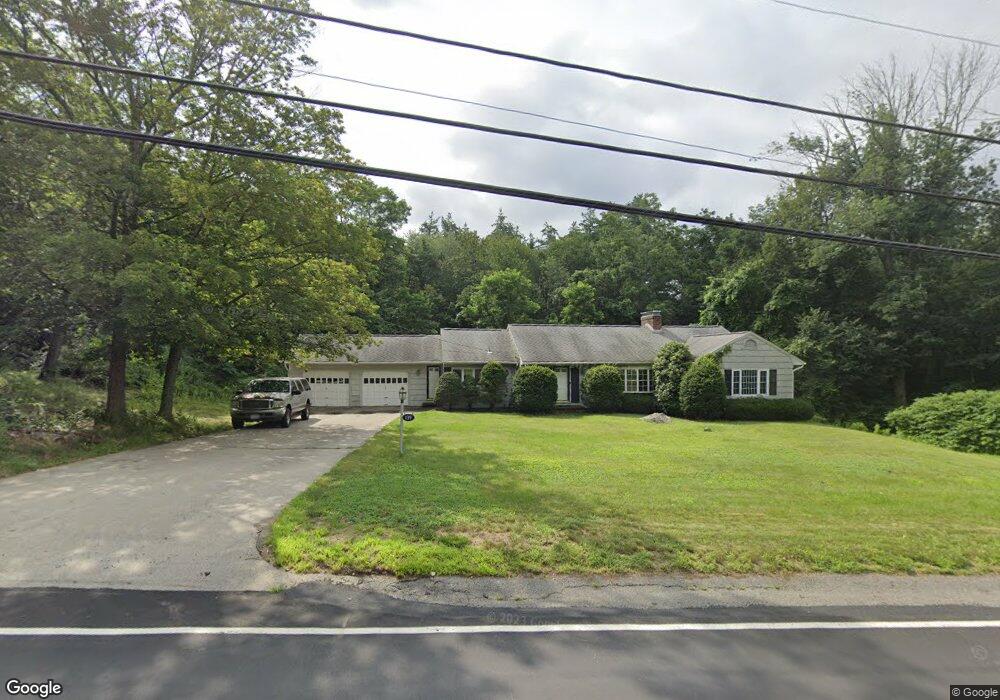
139 Range Rd Windham, NH 03087
Estimated Value: $553,000 - $799,000
3
Beds
4
Baths
2,048
Sq Ft
$334/Sq Ft
Est. Value
About This Home
This home is located at 139 Range Rd, Windham, NH 03087 and is currently estimated at $684,367, approximately $334 per square foot. 139 Range Rd is a home located in Rockingham County with nearby schools including Golden Brook Elementary School, Windham Middle School, and Windham High School.
Ownership History
Date
Name
Owned For
Owner Type
Purchase Details
Closed on
Nov 26, 2013
Sold by
Whelan Richard T Est and Young Kathleen M
Bought by
Whelan Richard and Heinlein Holly Lynn
Current Estimated Value
Purchase Details
Closed on
Sep 5, 2013
Sold by
Est Whelan Richard T and Young Kathleen M
Bought by
Granahan Donald and Granahan Kelley
Create a Home Valuation Report for This Property
The Home Valuation Report is an in-depth analysis detailing your home's value as well as a comparison with similar homes in the area
Home Values in the Area
Average Home Value in this Area
Purchase History
| Date | Buyer | Sale Price | Title Company |
|---|---|---|---|
| Whelan Richard | $335,000 | -- | |
| Whelan Richard | $335,000 | -- | |
| Granahan Donald | $170,000 | -- | |
| Granahan Donald | $170,000 | -- |
Source: Public Records
Mortgage History
| Date | Status | Borrower | Loan Amount |
|---|---|---|---|
| Closed | Granahan Donald | $0 |
Source: Public Records
Tax History
| Year | Tax Paid | Tax Assessment Tax Assessment Total Assessment is a certain percentage of the fair market value that is determined by local assessors to be the total taxable value of land and additions on the property. | Land | Improvement |
|---|---|---|---|---|
| 2024 | $8,741 | $386,100 | $163,700 | $222,400 |
| 2023 | $8,263 | $386,100 | $163,700 | $222,400 |
| 2022 | $7,629 | $386,100 | $163,700 | $222,400 |
| 2021 | $7,243 | $389,000 | $163,700 | $225,300 |
| 2020 | $7,442 | $389,000 | $163,700 | $225,300 |
| 2019 | $7,029 | $311,700 | $150,900 | $160,800 |
| 2018 | $7,259 | $311,700 | $150,900 | $160,800 |
| 2017 | $6,296 | $311,700 | $150,900 | $160,800 |
| 2016 | $6,801 | $311,700 | $150,900 | $160,800 |
| 2015 | $6,842 | $315,000 | $150,900 | $164,100 |
| 2014 | $6,689 | $278,700 | $180,000 | $98,700 |
| 2013 | $7,030 | $297,900 | $221,000 | $76,900 |
Source: Public Records
Map
Nearby Homes
Your Personal Tour Guide
Ask me questions while you tour the home.