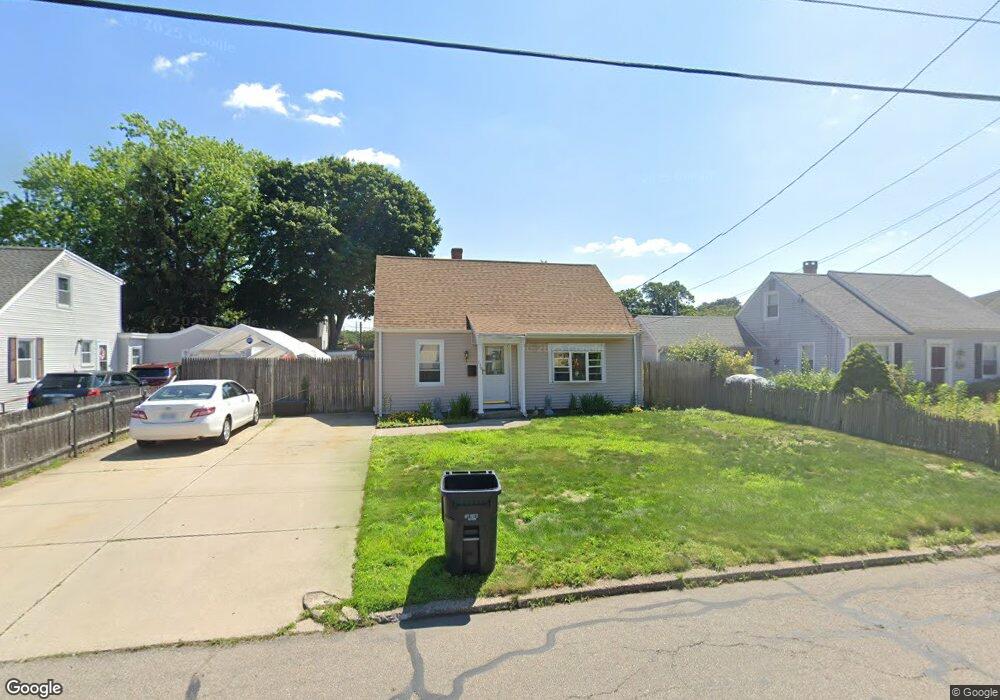
139 Rice St Pawtucket, RI 02861
Darlington NeighborhoodEstimated Value: $379,991 - $407,000
3
Beds
1
Bath
1,170
Sq Ft
$340/Sq Ft
Est. Value
About This Home
This home is located at 139 Rice St, Pawtucket, RI 02861 and is currently estimated at $397,748, approximately $339 per square foot. 139 Rice St is a home located in Providence County with nearby schools including St Cecilia School and Dayspring Christian Academy.
Ownership History
Date
Name
Owned For
Owner Type
Purchase Details
Closed on
May 30, 1997
Sold by
Macgregor M Phyllis
Bought by
Gity Julie Siras
Current Estimated Value
Purchase Details
Closed on
Oct 3, 1989
Sold by
Waddell H M Est
Bought by
Sirois Macgregor P
Create a Home Valuation Report for This Property
The Home Valuation Report is an in-depth analysis detailing your home's value as well as a comparison with similar homes in the area
Home Values in the Area
Average Home Value in this Area
Purchase History
| Date | Buyer | Sale Price | Title Company |
|---|---|---|---|
| Gity Julie Siras | $83,000 | -- | |
| Sirois Macgregor P | $10,000 | -- |
Source: Public Records
Mortgage History
| Date | Status | Borrower | Loan Amount |
|---|---|---|---|
| Open | Sirois Macgregor P | $178,492 | |
| Closed | Sirois Macgregor P | $116,300 | |
| Closed | Sirois Macgregor P | $74,624 | |
| Closed | Sirois Macgregor P | $72,000 |
Source: Public Records
Tax History Compared to Growth
Tax History
| Year | Tax Paid | Tax Assessment Tax Assessment Total Assessment is a certain percentage of the fair market value that is determined by local assessors to be the total taxable value of land and additions on the property. | Land | Improvement |
|---|---|---|---|---|
| 2025 | $3,863 | $293,800 | $149,900 | $143,900 |
| 2024 | $3,625 | $293,800 | $149,900 | $143,900 |
| 2023 | $3,615 | $213,400 | $91,600 | $121,800 |
| 2022 | $3,538 | $213,400 | $91,600 | $121,800 |
| 2021 | $3,538 | $213,400 | $91,600 | $121,800 |
| 2020 | $3,535 | $169,200 | $79,800 | $89,400 |
| 2019 | $3,535 | $169,200 | $79,800 | $89,400 |
| 2018 | $3,406 | $169,200 | $79,800 | $89,400 |
| 2017 | $3,560 | $156,700 | $73,300 | $83,400 |
| 2016 | $3,430 | $156,700 | $73,300 | $83,400 |
| 2015 | $3,430 | $156,700 | $73,300 | $83,400 |
| 2014 | $3,097 | $134,300 | $61,000 | $73,300 |
Source: Public Records
Map
Nearby Homes