Estimated Value: $493,288 - $570,000
3
Beds
2
Baths
1,202
Sq Ft
$446/Sq Ft
Est. Value
About This Home
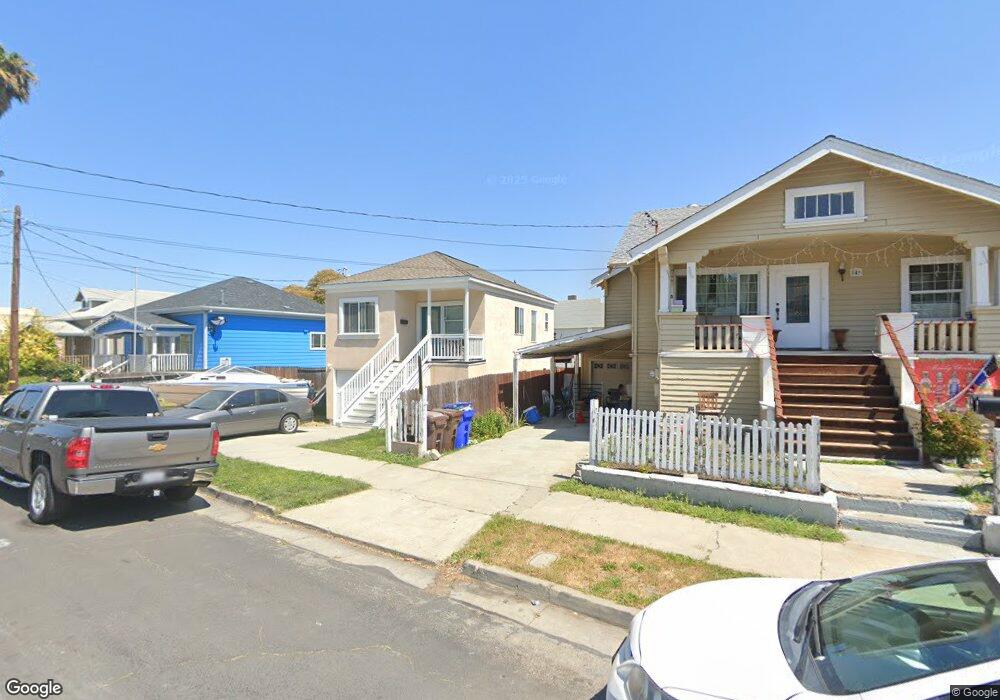
This home is located at 139 Rodeo Ave, Rodeo, CA 94572 and is currently estimated at $535,572, approximately $445 per square foot. 139 Rodeo Ave is a home located in Contra Costa County with nearby schools including Rodeo Hills Elementary School, Carquinez Middle School, and John Swett High School.
Ownership History
Date
Name
Owned For
Owner Type
Purchase Details
Closed on
Dec 26, 2017
Sold by
Spencer Amy E
Bought by
Spencer Ryan R
Current Estimated Value
Purchase Details
Closed on
Apr 17, 2008
Sold by
U S Bank Na
Bought by
Spencer Ryan and Spencer Amy
Purchase Details
Closed on
Feb 13, 2008
Sold by
Pitman Mirna Loy
Bought by
U S Bank Na
Purchase Details
Closed on
Jul 21, 2006
Sold by
Spencer Richard and Spencer Deborah
Bought by
Pitman Mirna Loy
Home Financials for this Owner
Home Financials are based on the most recent Mortgage that was taken out on this home.
Original Mortgage
$104,000
Interest Rate
6.7%
Mortgage Type
Unknown
Purchase Details
Closed on
Apr 18, 2005
Sold by
Spencer Ryan and Spencer Amy E
Bought by
Spencer Ryan R and Spencer Amy E
Purchase Details
Closed on
Jan 20, 2005
Sold by
Oliva Roger M and Oliva Corazon
Bought by
Spencer Richard and Spencer Deborah
Home Financials for this Owner
Home Financials are based on the most recent Mortgage that was taken out on this home.
Original Mortgage
$50,000
Interest Rate
5.69%
Mortgage Type
Seller Take Back
Create a Home Valuation Report for This Property
The Home Valuation Report is an in-depth analysis detailing your home's value as well as a comparison with similar homes in the area
Home Values in the Area
Average Home Value in this Area
Purchase History
| Date | Buyer | Sale Price | Title Company |
|---|---|---|---|
| Spencer Ryan R | -- | None Available | |
| Spencer Ryan | $235,000 | Lsi Title Company | |
| U S Bank Na | $376,587 | None Available | |
| Pitman Mirna Loy | $520,000 | Chicago Title Co | |
| Spencer Ryan R | -- | -- | |
| Spencer Richard | $313,000 | Old Republic Title |
Source: Public Records
Mortgage History
| Date | Status | Borrower | Loan Amount |
|---|---|---|---|
| Previous Owner | Pitman Mirna Loy | $104,000 | |
| Previous Owner | Pitman Mirna Loy | $416,000 | |
| Previous Owner | Spencer Richard | $50,000 |
Source: Public Records
Tax History Compared to Growth
Tax History
| Year | Tax Paid | Tax Assessment Tax Assessment Total Assessment is a certain percentage of the fair market value that is determined by local assessors to be the total taxable value of land and additions on the property. | Land | Improvement |
|---|---|---|---|---|
| 2025 | $5,164 | $308,658 | $203,586 | $105,072 |
| 2024 | $5,095 | $302,607 | $199,595 | $103,012 |
| 2023 | $5,095 | $296,675 | $195,682 | $100,993 |
| 2022 | $4,961 | $290,859 | $191,846 | $99,013 |
| 2021 | $4,873 | $285,157 | $188,085 | $97,072 |
| 2019 | $4,756 | $276,701 | $182,507 | $94,194 |
| 2018 | $4,635 | $271,277 | $178,929 | $92,348 |
| 2017 | $4,553 | $265,959 | $175,421 | $90,538 |
| 2016 | $4,186 | $260,745 | $171,982 | $88,763 |
| 2015 | $4,043 | $247,000 | $162,916 | $84,084 |
| 2014 | $3,034 | $158,000 | $104,213 | $53,787 |
Source: Public Records
Map
Nearby Homes
- 150 Rodeo Ave
- 201 Lake Ave
- 343 Rodeo Ave
- 715 Mariposa Ave
- 60 Railroad Ave
- 220 Vaqueros Ave
- 808 4th St
- 832 Mariposa Ave
- 544 Napa Ave
- 1124 Mahoney St
- 725 Vaqueros Ave
- 836 Hawthorne Dr
- 867 Hawthorne Dr
- 1186 Waverly Cir
- 1006 Chelsea
- 943 Coral Ridge Cir
- 817 Ketch Ct
- 802 Dover
- 1861 Shasta Ln
- 996 Coral Ridge Cir