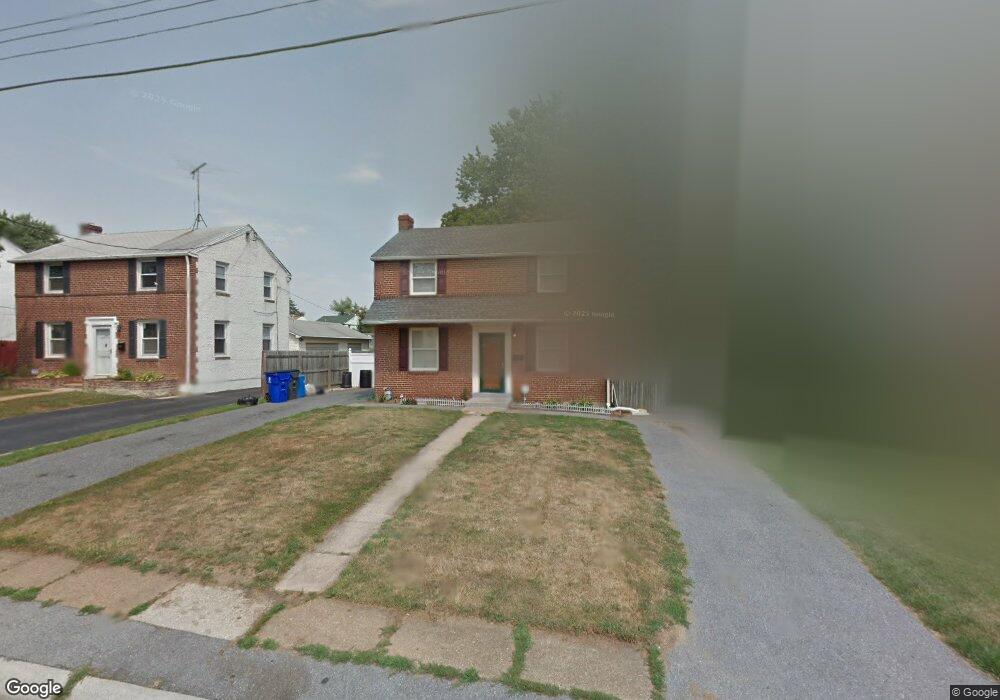
139 Rodney Dr New Castle, DE 19720
Estimated Value: $260,000 - $271,000
3
Beds
1
Bath
1,232
Sq Ft
$217/Sq Ft
Est. Value
About This Home
This home is located at 139 Rodney Dr, New Castle, DE 19720 and is currently estimated at $267,070, approximately $216 per square foot. 139 Rodney Dr is a home located in New Castle County with nearby schools including New Castle Elementary School, Calvin R. McCullough Middle School, and Charter School of New Castle.
Ownership History
Date
Name
Owned For
Owner Type
Purchase Details
Closed on
Jan 14, 2011
Sold by
Rodriguez Joseph M
Bought by
Evangelista Janet
Current Estimated Value
Purchase Details
Closed on
Dec 29, 2006
Sold by
Lipton Jacob W
Bought by
Rodriguez Joseph M and Evangelista Janet
Home Financials for this Owner
Home Financials are based on the most recent Mortgage that was taken out on this home.
Original Mortgage
$188,510
Interest Rate
6.24%
Mortgage Type
FHA
Purchase Details
Closed on
Jul 12, 2006
Sold by
Hall Catherine
Bought by
Lipton Jacob W
Home Financials for this Owner
Home Financials are based on the most recent Mortgage that was taken out on this home.
Original Mortgage
$120,250
Interest Rate
6.67%
Mortgage Type
Purchase Money Mortgage
Create a Home Valuation Report for This Property
The Home Valuation Report is an in-depth analysis detailing your home's value as well as a comparison with similar homes in the area
Home Values in the Area
Average Home Value in this Area
Purchase History
| Date | Buyer | Sale Price | Title Company |
|---|---|---|---|
| Evangelista Janet | $955 | None Available | |
| Rodriguez Joseph M | $190,000 | None Available | |
| Lipton Jacob W | $100,000 | None Available |
Source: Public Records
Mortgage History
| Date | Status | Borrower | Loan Amount |
|---|---|---|---|
| Previous Owner | Rodriguez Joseph M | $188,510 | |
| Previous Owner | Lipton Jacob W | $120,250 |
Source: Public Records
Tax History Compared to Growth
Tax History
| Year | Tax Paid | Tax Assessment Tax Assessment Total Assessment is a certain percentage of the fair market value that is determined by local assessors to be the total taxable value of land and additions on the property. | Land | Improvement |
|---|---|---|---|---|
| 2024 | $1,184 | $34,500 | $5,500 | $29,000 |
| 2023 | $1,077 | $34,500 | $5,500 | $29,000 |
| 2022 | $1,122 | $34,500 | $5,500 | $29,000 |
| 2021 | $1,121 | $34,500 | $5,500 | $29,000 |
| 2020 | $1,128 | $34,500 | $5,500 | $29,000 |
| 2019 | $1,825 | $34,500 | $5,500 | $29,000 |
| 2018 | $1,866 | $34,500 | $5,500 | $29,000 |
| 2017 | $1,035 | $34,500 | $5,500 | $29,000 |
| 2016 | $926 | $34,500 | $5,500 | $29,000 |
| 2015 | $925 | $34,500 | $5,500 | $29,000 |
| 2014 | $926 | $34,500 | $5,500 | $29,000 |
Source: Public Records
Map
Nearby Homes