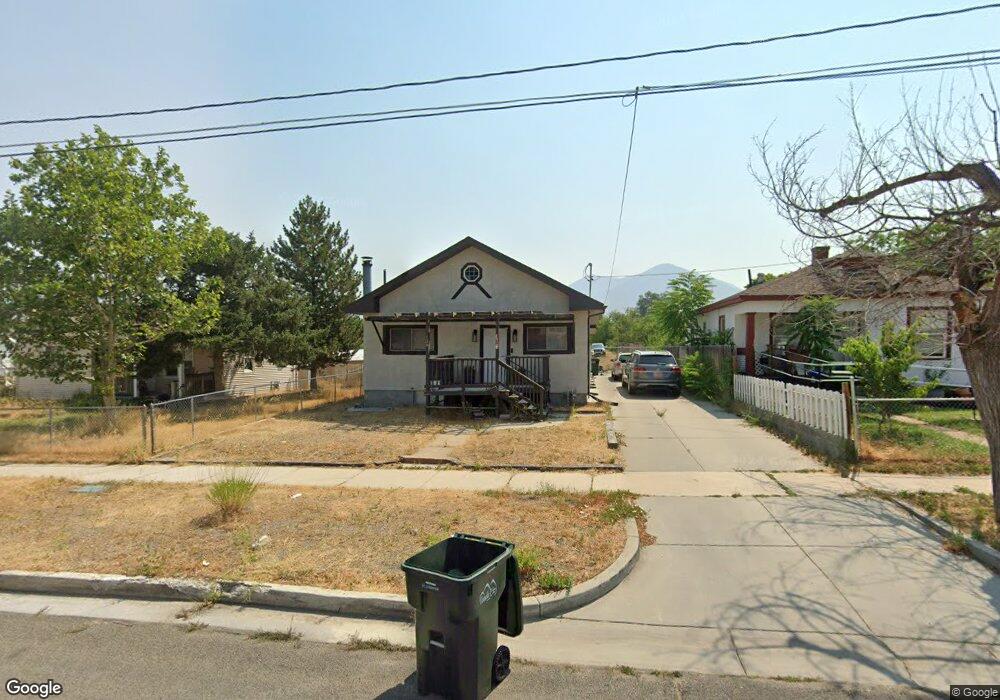
139 S 200 W Tooele, UT 84074
Estimated Value: $360,000 - $399,395
4
Beds
2
Baths
1,988
Sq Ft
$190/Sq Ft
Est. Value
About This Home
This home is located at 139 S 200 W, Tooele, UT 84074 and is currently estimated at $377,849, approximately $190 per square foot. 139 S 200 W is a home located in Tooele County with nearby schools including West Elementary School, Northlake Elementary School, and Tooele Junior High School.
Ownership History
Date
Name
Owned For
Owner Type
Purchase Details
Closed on
Aug 26, 2019
Sold by
Bm Re Llc
Bought by
Camper Brock James and Camper Sarah
Current Estimated Value
Home Financials for this Owner
Home Financials are based on the most recent Mortgage that was taken out on this home.
Original Mortgage
$239,580
Outstanding Balance
$211,377
Interest Rate
3.96%
Mortgage Type
FHA
Estimated Equity
$166,472
Purchase Details
Closed on
Sep 30, 2005
Sold by
Fifield Timothy L and Massey Dawn
Bought by
Depew Kyle M
Home Financials for this Owner
Home Financials are based on the most recent Mortgage that was taken out on this home.
Original Mortgage
$134,290
Interest Rate
5.63%
Mortgage Type
VA
Purchase Details
Closed on
Jun 14, 2005
Sold by
Fifield Timothy L
Bought by
Fifield Timothy L and Massey Dawn
Create a Home Valuation Report for This Property
The Home Valuation Report is an in-depth analysis detailing your home's value as well as a comparison with similar homes in the area
Home Values in the Area
Average Home Value in this Area
Purchase History
| Date | Buyer | Sale Price | Title Company |
|---|---|---|---|
| Camper Brock James | -- | Capstone T&E Inc | |
| Depew Kyle M | -- | B & D Title Co Of Tooele Inc | |
| Fifield Timothy L | -- | None Available |
Source: Public Records
Mortgage History
| Date | Status | Borrower | Loan Amount |
|---|---|---|---|
| Open | Camper Brock James | $239,580 | |
| Previous Owner | Depew Kyle M | $134,290 |
Source: Public Records
Tax History Compared to Growth
Tax History
| Year | Tax Paid | Tax Assessment Tax Assessment Total Assessment is a certain percentage of the fair market value that is determined by local assessors to be the total taxable value of land and additions on the property. | Land | Improvement |
|---|---|---|---|---|
| 2025 | $2,632 | $219,539 | $63,305 | $156,234 |
| 2024 | $2,678 | $204,383 | $63,305 | $141,078 |
| 2023 | $2,678 | $195,191 | $60,976 | $134,215 |
| 2022 | $2,158 | $185,686 | $62,040 | $123,646 |
| 2021 | $1,847 | $132,950 | $41,360 | $91,590 |
| 2020 | $1,736 | $216,652 | $50,125 | $166,527 |
| 2019 | $1,551 | $190,499 | $50,125 | $140,374 |
| 2018 | $1,456 | $169,564 | $47,500 | $122,064 |
| 2017 | $990 | $134,830 | $34,625 | $100,205 |
| 2016 | $846 | $68,181 | $19,044 | $49,137 |
| 2015 | $846 | $61,524 | $0 | $0 |
| 2014 | -- | $61,524 | $0 | $0 |
Source: Public Records
Map
Nearby Homes