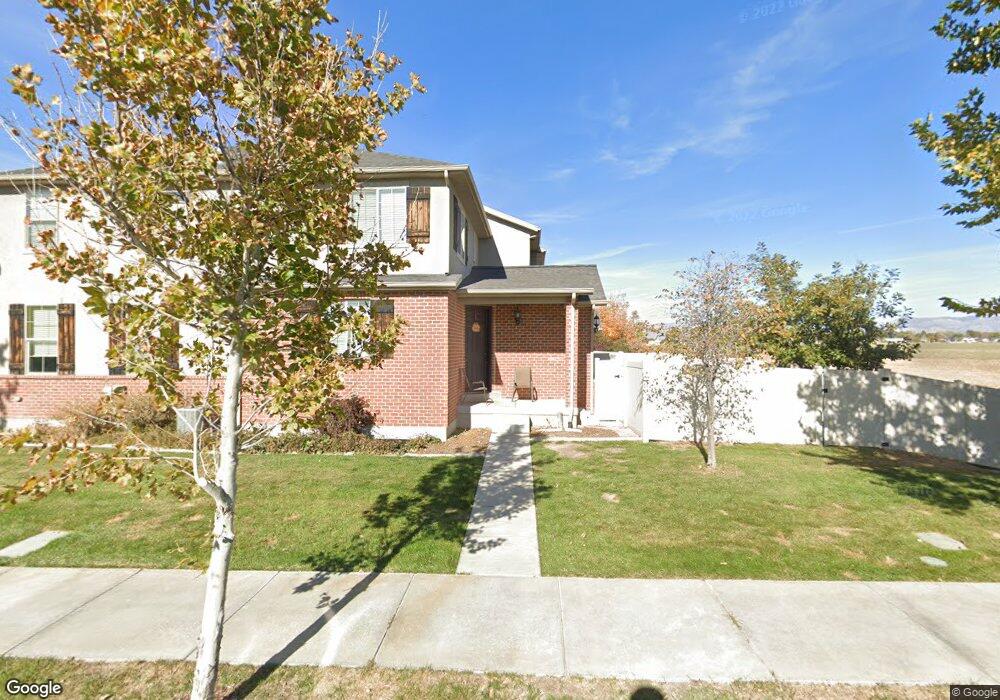
139 S 2775 W West Point, UT 84015
Estimated Value: $396,000 - $414,000
3
Beds
3
Baths
2,189
Sq Ft
$186/Sq Ft
Est. Value
About This Home
This home is located at 139 S 2775 W, West Point, UT 84015 and is currently estimated at $407,478, approximately $186 per square foot. 139 S 2775 W is a home located in Davis County with nearby schools including West Point School, West Point Junior High School, and Syracuse High School.
Ownership History
Date
Name
Owned For
Owner Type
Purchase Details
Closed on
May 11, 2020
Sold by
Johnson Jeff
Bought by
Johnson Jeff Casteel
Current Estimated Value
Home Financials for this Owner
Home Financials are based on the most recent Mortgage that was taken out on this home.
Original Mortgage
$107,000
Outstanding Balance
$74,295
Interest Rate
3.3%
Mortgage Type
New Conventional
Estimated Equity
$333,183
Purchase Details
Closed on
Jan 30, 2012
Sold by
Ivory Towns Llc
Bought by
Johnson Jeff
Home Financials for this Owner
Home Financials are based on the most recent Mortgage that was taken out on this home.
Original Mortgage
$168,277
Interest Rate
4.37%
Mortgage Type
FHA
Create a Home Valuation Report for This Property
The Home Valuation Report is an in-depth analysis detailing your home's value as well as a comparison with similar homes in the area
Home Values in the Area
Average Home Value in this Area
Purchase History
| Date | Buyer | Sale Price | Title Company |
|---|---|---|---|
| Johnson Jeff Casteel | -- | Greenbrier Ttl Ins Agcy Inc | |
| Johnson Jeff | -- | Cottonwood Title Ins | |
| Ivory Towns Llc | -- | Cottonwood Title In |
Source: Public Records
Mortgage History
| Date | Status | Borrower | Loan Amount |
|---|---|---|---|
| Open | Johnson Jeff Casteel | $107,000 | |
| Closed | Johnson Jeff | $168,277 |
Source: Public Records
Tax History Compared to Growth
Tax History
| Year | Tax Paid | Tax Assessment Tax Assessment Total Assessment is a certain percentage of the fair market value that is determined by local assessors to be the total taxable value of land and additions on the property. | Land | Improvement |
|---|---|---|---|---|
| 2025 | $2,177 | $204,050 | $72,600 | $131,450 |
| 2024 | $2,261 | $212,850 | $52,250 | $160,600 |
| 2023 | $2,160 | $205,700 | $48,400 | $157,300 |
| 2022 | $2,165 | $373,000 | $84,000 | $289,000 |
| 2021 | $1,961 | $278,000 | $67,000 | $211,000 |
| 2020 | $1,823 | $255,000 | $62,400 | $192,600 |
| 2019 | $1,754 | $242,000 | $60,000 | $182,000 |
| 2018 | $1,699 | $231,000 | $62,000 | $169,000 |
| 2016 | $1,477 | $105,710 | $20,900 | $84,810 |
| 2015 | $1,490 | $101,035 | $20,900 | $80,135 |
| 2014 | $1,607 | $110,522 | $15,400 | $95,122 |
| 2013 | -- | $103,488 | $15,400 | $88,088 |
Source: Public Records
Map
Nearby Homes
- 1159 S 4350 W
- 2792 W 50 S
- 164 S 2875 W
- 2633 N 2080 W Unit 180
- 2623 N 2080 W Unit 178
- 380 S 4300 W Unit 608
- 997 N 5100 W Unit 213
- 2619 N 2080 W Unit 177
- 2627 N 2080 W Unit 179
- 3232 W 375 N Unit 7
- 3258 W 375 N Unit 9
- 260 W Antelope Dr S
- 4200 W 800 N
- 488 N 3100 W
- 2535 W 550 N
- 2283 W 470 N
- 3187 W 525 N
- 2000 Farmhouse Plan at Legacy Park - Collection
- 2000 Farmhouse Select Plan at Legacy Park - Collection
- San Marino Craftsman Plan at Legacy Park - Estates