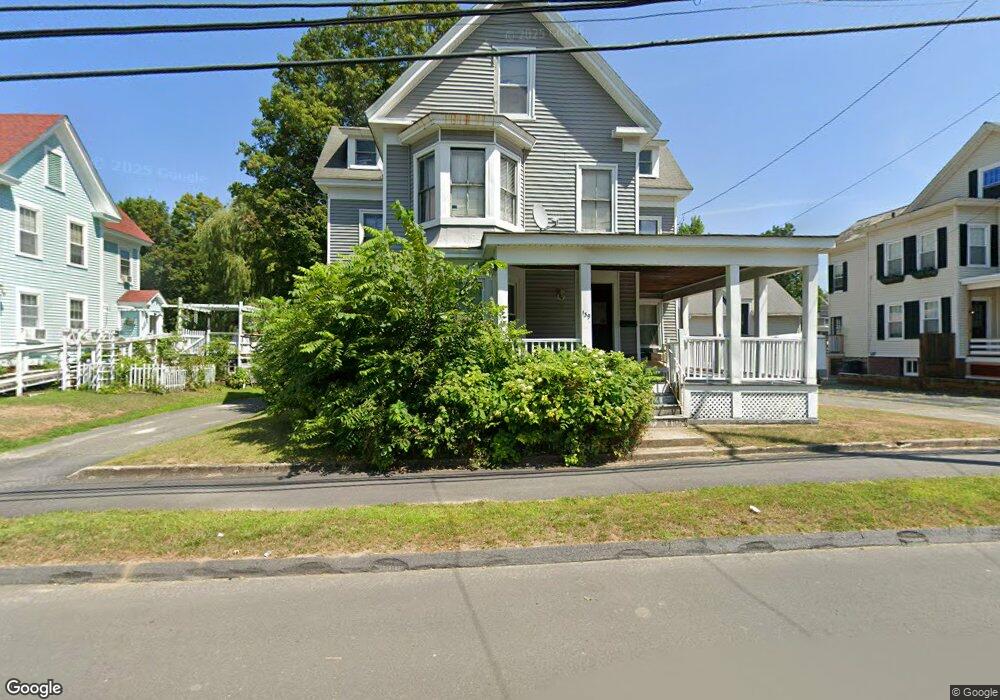
139 S Main St Orange, MA 01364
Estimated Value: $240,000 - $342,000
4
Beds
3
Baths
2,630
Sq Ft
$108/Sq Ft
Est. Value
About This Home
This home is located at 139 S Main St, Orange, MA 01364 and is currently estimated at $285,179, approximately $108 per square foot. 139 S Main St is a home located in Franklin County with nearby schools including Fisher Hill and Ralph C Mahar Regional School.
Ownership History
Date
Name
Owned For
Owner Type
Purchase Details
Closed on
Feb 25, 2020
Sold by
Barbato Susan I
Bought by
Barbato Shane
Current Estimated Value
Home Financials for this Owner
Home Financials are based on the most recent Mortgage that was taken out on this home.
Original Mortgage
$103,000
Outstanding Balance
$91,393
Interest Rate
3.6%
Mortgage Type
New Conventional
Estimated Equity
$193,786
Purchase Details
Closed on
Feb 26, 2004
Sold by
Barbato Michael S
Bought by
Barbato Michael S and Barbato Susan I
Create a Home Valuation Report for This Property
The Home Valuation Report is an in-depth analysis detailing your home's value as well as a comparison with similar homes in the area
Home Values in the Area
Average Home Value in this Area
Purchase History
| Date | Buyer | Sale Price | Title Company |
|---|---|---|---|
| Barbato Shane | $135,000 | None Available | |
| Barbato Michael S | -- | -- |
Source: Public Records
Mortgage History
| Date | Status | Borrower | Loan Amount |
|---|---|---|---|
| Open | Barbato Shane | $103,000 |
Source: Public Records
Tax History
| Year | Tax Paid | Tax Assessment Tax Assessment Total Assessment is a certain percentage of the fair market value that is determined by local assessors to be the total taxable value of land and additions on the property. | Land | Improvement |
|---|---|---|---|---|
| 2025 | $43 | $259,700 | $23,900 | $235,800 |
| 2024 | $4,065 | $233,100 | $23,900 | $209,200 |
| 2023 | $4,045 | $225,200 | $21,500 | $203,700 |
| 2022 | $3,746 | $195,900 | $21,500 | $174,400 |
| 2021 | $3,306 | $164,900 | $42,100 | $122,800 |
| 2020 | $2,864 | $140,900 | $38,400 | $102,500 |
| 2019 | $2,829 | $125,600 | $33,200 | $92,400 |
| 2018 | $2,824 | $128,700 | $31,000 | $97,700 |
| 2017 | $2,732 | $128,700 | $31,000 | $97,700 |
| 2016 | $2,515 | $115,900 | $27,700 | $88,200 |
| 2015 | $2,372 | $114,200 | $29,600 | $84,600 |
| 2014 | $2,673 | $135,400 | $29,600 | $105,800 |
Source: Public Records
Map
Nearby Homes
Your Personal Tour Guide
Ask me questions while you tour the home.