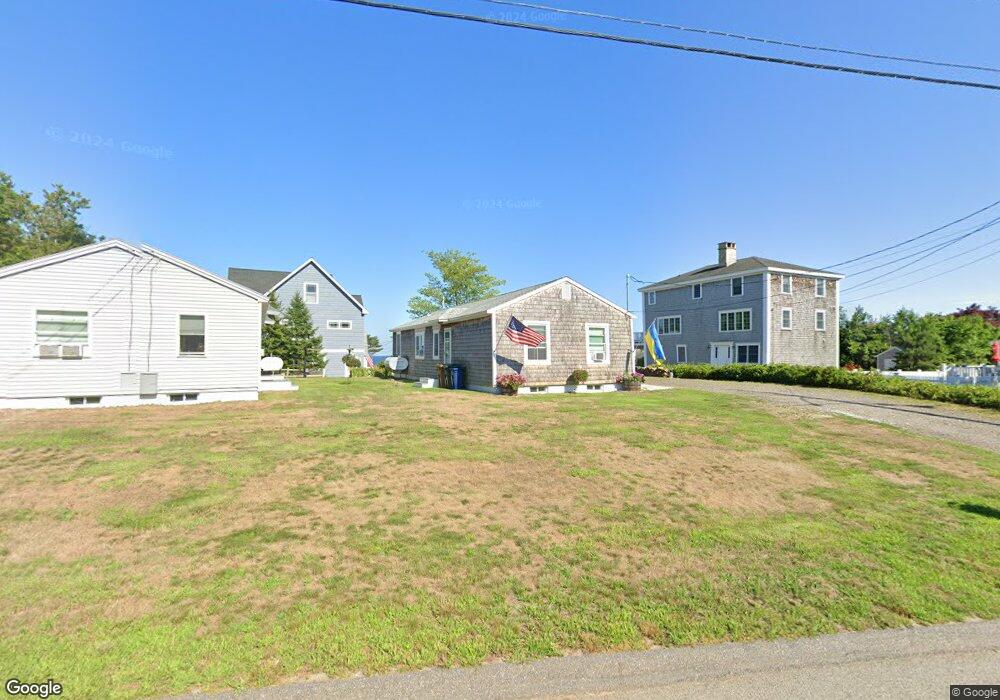
139 Seaside Ave Saco, ME 04072
Ferry Beach NeighborhoodEstimated Value: $938,000 - $1,363,000
Studio
--
Bath
--
Sq Ft
20,691
Sq Ft Lot
About This Home
This home is located at 139 Seaside Ave, Saco, ME 04072 and is currently estimated at $1,187,475. 139 Seaside Ave is a home with nearby schools including C K Burns School, Saco Middle School, and Florence Lombard Christian School.
Ownership History
Date
Name
Owned For
Owner Type
Purchase Details
Closed on
Aug 4, 2021
Sold by
Tina M Pagano T M and Tina Pagano
Bought by
Tina M Pagano Lt and Pagano
Current Estimated Value
Purchase Details
Closed on
Feb 10, 2011
Sold by
Jean Wallace Pagano Ret and Pagano
Bought by
Pagano Robert A and Pagano Gisele M
Purchase Details
Closed on
Aug 10, 2005
Sold by
Jean Wallace Pagno Ret and Pagano
Bought by
Tina M Pagano T M and Tina Pagano
Create a Home Valuation Report for This Property
The Home Valuation Report is an in-depth analysis detailing your home's value as well as a comparison with similar homes in the area
Home Values in the Area
Average Home Value in this Area
Purchase History
| Date | Buyer | Sale Price | Title Company |
|---|---|---|---|
| Tina M Pagano Lt | -- | None Available | |
| Tina M Pagano Lt | -- | None Available | |
| Tina M Pagano Lt | -- | None Available | |
| Pagano Robert A | -- | -- | |
| Tina M Pagano T M | -- | -- | |
| Pagano Robert A | -- | -- | |
| Tina M Pagano T M | -- | -- |
Source: Public Records
Tax History
| Year | Tax Paid | Tax Assessment Tax Assessment Total Assessment is a certain percentage of the fair market value that is determined by local assessors to be the total taxable value of land and additions on the property. | Land | Improvement |
|---|---|---|---|---|
| 2024 | $11,830 | $842,000 | $526,100 | $315,900 |
| 2023 | $12,461 | $844,800 | $526,100 | $318,700 |
| 2022 | $11,396 | $621,700 | $374,700 | $247,000 |
| 2021 | $10,841 | $574,200 | $357,600 | $216,600 |
| 2020 | $10,748 | $546,400 | $349,100 | $197,300 |
| 2019 | $10,589 | $546,400 | $349,100 | $197,300 |
| 2018 | $10,425 | $537,900 | $340,600 | $197,300 |
| 2017 | $9,500 | $490,200 | $309,600 | $180,600 |
| 2016 | $9,318 | $479,800 | $301,900 | $177,900 |
| 2015 | $8,643 | $449,700 | $274,000 | $175,700 |
| 2014 | $8,273 | $444,300 | $268,600 | $175,700 |
| 2013 | $8,225 | $442,700 | $267,000 | $175,700 |
Source: Public Records
Map
Nearby Homes
- 10 Lower Beach Rd
- 46 Ferry Ln
- 1 Main Ave
- 9 Riverside Ave
- 311 Seaside Ave Unit 5
- 280 Seaside Ave
- 30 Vines Rd
- 3 Walker Dr Unit 101
- 5 Red Oak Ln
- 4 Walker Dr Unit 101
- 3 Walker Dr Unit 101
- 650 Pool St
- 625 Pool St
- TBD 530 Ferry Rd
- 295 Ferry Rd
- 125 Hills Beach Rd
- 378 Pool St
- 353 Pool St
- 74 Guinea Rd
- 8 Days Landing
Your Personal Tour Guide
Ask me questions while you tour the home.