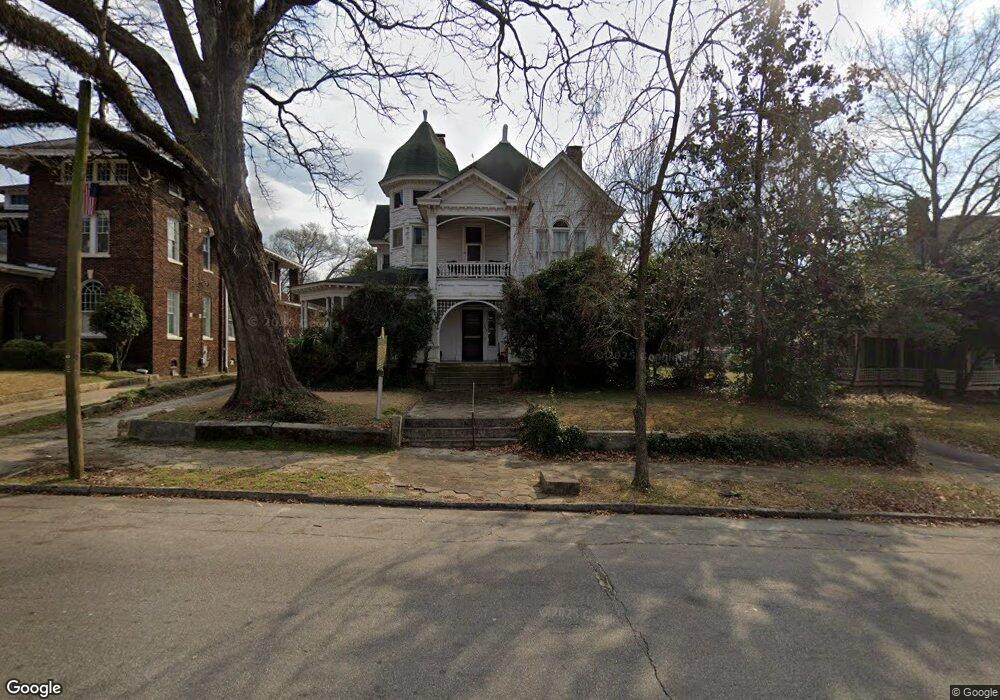
139 Taylor St Americus, GA 31709
Estimated Value: $272,000 - $363,000
4
Beds
3
Baths
4,130
Sq Ft
$75/Sq Ft
Est. Value
About This Home
This home is located at 139 Taylor St, Americus, GA 31709 and is currently estimated at $310,031, approximately $75 per square foot. 139 Taylor St is a home located in Sumter County with nearby schools including Sumter County Primary School, Sumter County Elementary School, and Sumter County Middle School.
Ownership History
Date
Name
Owned For
Owner Type
Purchase Details
Closed on
Jun 3, 2016
Sold by
Ruth Davis Lynch Etheridge
Bought by
Crisp Charles
Current Estimated Value
Home Financials for this Owner
Home Financials are based on the most recent Mortgage that was taken out on this home.
Original Mortgage
$288,000
Outstanding Balance
$229,886
Interest Rate
3.66%
Estimated Equity
$80,145
Purchase Details
Closed on
Oct 12, 1995
Sold by
Jones Robert J Mrs
Bought by
Crisp Charles F
Create a Home Valuation Report for This Property
The Home Valuation Report is an in-depth analysis detailing your home's value as well as a comparison with similar homes in the area
Home Values in the Area
Average Home Value in this Area
Purchase History
| Date | Buyer | Sale Price | Title Company |
|---|---|---|---|
| Crisp Charles | -- | -- | |
| Crisp Charles F | $121,000 | -- |
Source: Public Records
Mortgage History
| Date | Status | Borrower | Loan Amount |
|---|---|---|---|
| Open | Crisp Charles | $288,000 | |
| Closed | Crisp Charles | -- |
Source: Public Records
Tax History Compared to Growth
Tax History
| Year | Tax Paid | Tax Assessment Tax Assessment Total Assessment is a certain percentage of the fair market value that is determined by local assessors to be the total taxable value of land and additions on the property. | Land | Improvement |
|---|---|---|---|---|
| 2024 | $3,349 | $75,640 | $4,640 | $71,000 |
| 2023 | $3,277 | $75,640 | $4,640 | $71,000 |
| 2022 | $2,225 | $75,640 | $4,640 | $71,000 |
| 2021 | $3,282 | $75,640 | $4,640 | $71,000 |
| 2020 | $3,360 | $75,640 | $4,640 | $71,000 |
| 2019 | $3,556 | $75,640 | $4,640 | $71,000 |
| 2018 | $2,316 | $75,640 | $4,640 | $71,000 |
| 2017 | $2,316 | $75,640 | $4,640 | $71,000 |
| 2016 | $3,200 | $73,840 | $4,640 | $69,200 |
| 2015 | $2,401 | $80,440 | $4,640 | $75,800 |
| 2014 | $2,406 | $80,440 | $4,640 | $75,800 |
| 2013 | -- | $80,440 | $4,640 | $75,800 |
Source: Public Records
Map
Nearby Homes