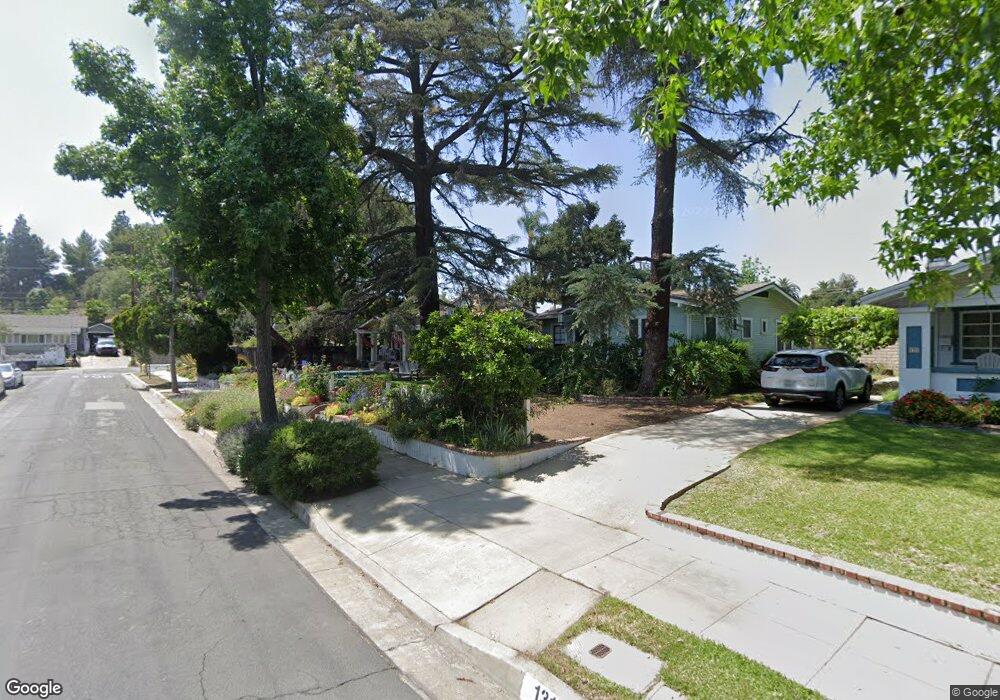
139 W 6th St San Dimas, CA 91773
Estimated Value: $876,000 - $1,091,000
4
Beds
2
Baths
1,728
Sq Ft
$572/Sq Ft
Est. Value
About This Home
This home is located at 139 W 6th St, San Dimas, CA 91773 and is currently estimated at $988,603, approximately $572 per square foot. 139 W 6th St is a home located in Los Angeles County with nearby schools including Fred Ekstrand Elementary School, Lone Hill Middle School, and San Dimas High School.
Ownership History
Date
Name
Owned For
Owner Type
Purchase Details
Closed on
Jun 30, 2006
Sold by
Archbold Thomas B and Archbold Mary Teresa
Bought by
Archbold Thomas B and Archbold Mary Teresa
Current Estimated Value
Purchase Details
Closed on
May 29, 2001
Sold by
Hansen Robert and Hansen Michelle
Bought by
Archbold Thomas B and Archbold Mary Teresa
Home Financials for this Owner
Home Financials are based on the most recent Mortgage that was taken out on this home.
Original Mortgage
$200,000
Outstanding Balance
$76,184
Interest Rate
7.14%
Estimated Equity
$912,419
Purchase Details
Closed on
Apr 26, 1994
Sold by
Dipple Terry L and Dipple Kimberly S
Bought by
Hansen Robert and Hansen Michelle
Home Financials for this Owner
Home Financials are based on the most recent Mortgage that was taken out on this home.
Original Mortgage
$187,500
Interest Rate
7.79%
Create a Home Valuation Report for This Property
The Home Valuation Report is an in-depth analysis detailing your home's value as well as a comparison with similar homes in the area
Home Values in the Area
Average Home Value in this Area
Purchase History
| Date | Buyer | Sale Price | Title Company |
|---|---|---|---|
| Archbold Thomas B | -- | None Available | |
| Archbold Thomas B | $345,000 | Southland Title | |
| Hansen Robert | $250,000 | Southland Title Corporation |
Source: Public Records
Mortgage History
| Date | Status | Borrower | Loan Amount |
|---|---|---|---|
| Open | Archbold Thomas B | $200,000 | |
| Previous Owner | Hansen Robert | $187,500 |
Source: Public Records
Tax History
| Year | Tax Paid | Tax Assessment Tax Assessment Total Assessment is a certain percentage of the fair market value that is determined by local assessors to be the total taxable value of land and additions on the property. | Land | Improvement |
|---|---|---|---|---|
| 2025 | $6,273 | $519,839 | $218,479 | $301,360 |
| 2024 | $6,273 | $509,647 | $214,196 | $295,451 |
| 2023 | $6,132 | $499,655 | $209,997 | $289,658 |
| 2022 | $6,030 | $489,859 | $205,880 | $283,979 |
| 2021 | $5,910 | $480,255 | $201,844 | $278,411 |
| 2019 | $5,793 | $466,012 | $195,858 | $270,154 |
| 2018 | $5,537 | $456,875 | $192,018 | $264,857 |
| 2016 | $5,325 | $439,135 | $184,562 | $254,573 |
| 2015 | $5,239 | $432,540 | $181,790 | $250,750 |
| 2014 | $5,187 | $424,068 | $178,229 | $245,839 |
Source: Public Records
Map
Nearby Homes
- 0 Dallas Rd Unit WS25141209
- 0 0 W 5th St
- 214 E 4th St
- 442 Walker Rd
- 100 Rawlinsdale Ln
- 208 E 3rd St
- 254 E 4th St
- 736 N Walnut Ave
- 539 W Gladstone St
- 150 S Monte Vista Ave
- 233 N Basilio Ave
- 317 Pony Express Rd
- 606 N Pershore Ave
- 107 E Baseline Rd
- 919 Auburn Rd
- 158 E Commercial St
- 530 Conestoga Rd
- 631 Pearlanna Dr
- 433 N Shaftesbury Ave
- 819 N Shaftesbury Ave
- 135 W 6th St
- 610 N Monte Vista Ave
- 131 W 6th St
- 127 W 6th St
- 138 W Gladstone St
- 112 W 6th St
- 605 N Monte Vista Ave
- 134 W Gladstone St
- 609 N Monte Vista Ave
- 624 N Monte Vista Ave Unit A
- 624 N Monte Vista Ave
- 601 N Monte Vista Ave
- 140 W 6th St
- 123 W 6th St
- 613 N Monte Vista Ave
- 144 W 6th St
- 624 A N Monte Vista Ave
- 130 W Gladstone St
- 529 N Monte Vista Ave
- 136 W 6th St
Your Personal Tour Guide
Ask me questions while you tour the home.