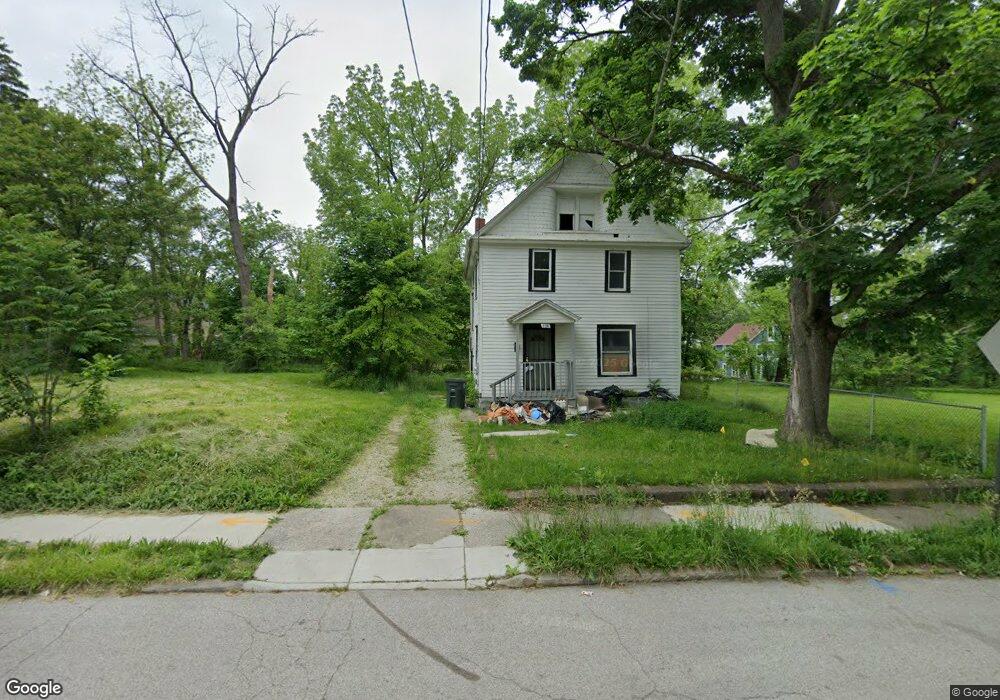
139 W Long St Akron, OH 44301
Summit Lake NeighborhoodEstimated Value: $90,140 - $117,000
3
Beds
2
Baths
1,904
Sq Ft
$54/Sq Ft
Est. Value
About This Home
This home is located at 139 W Long St, Akron, OH 44301 and is currently estimated at $102,285, approximately $53 per square foot. 139 W Long St is a home located in Summit County with nearby schools including McEbright Elementary School, Kenmore Garfield Community Learning Center, and Main Preparatory Academy.
Ownership History
Date
Name
Owned For
Owner Type
Purchase Details
Closed on
May 16, 2023
Sold by
Shuz Incorporated
Bought by
Clandestine Enterprise Corporation
Current Estimated Value
Purchase Details
Closed on
May 15, 2023
Sold by
Shuz Incorporated
Bought by
Clandestine Enterprise Corporation
Purchase Details
Closed on
Mar 18, 1997
Sold by
Calmese Sushone M
Bought by
Shuz Inc
Purchase Details
Closed on
Feb 14, 1997
Sold by
Shrf Hattie L Heal Pr
Bought by
Calmese Sushone M
Create a Home Valuation Report for This Property
The Home Valuation Report is an in-depth analysis detailing your home's value as well as a comparison with similar homes in the area
Home Values in the Area
Average Home Value in this Area
Purchase History
| Date | Buyer | Sale Price | Title Company |
|---|---|---|---|
| Clandestine Enterprise Corporation | $18,000 | None Listed On Document | |
| Clandestine Enterprise Corporation | $18,000 | None Listed On Document | |
| Shuz Inc | $14,000 | -- | |
| Calmese Sushone M | $14,000 | -- |
Source: Public Records
Tax History Compared to Growth
Tax History
| Year | Tax Paid | Tax Assessment Tax Assessment Total Assessment is a certain percentage of the fair market value that is determined by local assessors to be the total taxable value of land and additions on the property. | Land | Improvement |
|---|---|---|---|---|
| 2025 | $3,073 | $14,179 | $3,570 | $10,609 |
| 2024 | $832 | $14,179 | $3,570 | $10,609 |
| 2023 | $3,073 | $14,179 | $3,570 | $10,609 |
| 2022 | $645 | $8,341 | $2,100 | $6,241 |
| 2021 | $645 | $8,341 | $2,100 | $6,241 |
| 2020 | $637 | $8,340 | $2,100 | $6,240 |
| 2019 | $626 | $7,430 | $2,520 | $4,910 |
| 2018 | $619 | $7,430 | $2,520 | $4,910 |
| 2017 | $638 | $7,430 | $2,520 | $4,910 |
| 2016 | $638 | $7,570 | $2,520 | $5,050 |
| 2015 | $638 | $7,570 | $2,520 | $5,050 |
| 2014 | $633 | $7,570 | $2,520 | $5,050 |
| 2013 | $666 | $8,200 | $2,520 | $5,680 |
Source: Public Records
Map
Nearby Homes