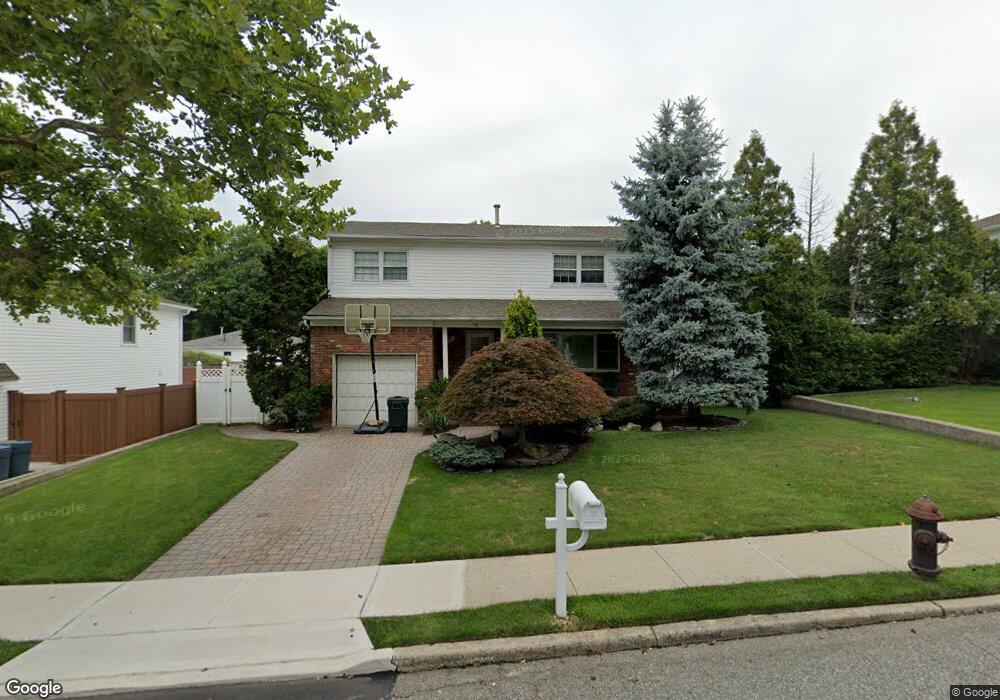
139 Weaver St Staten Island, NY 10312
Annadale NeighborhoodEstimated Value: $1,075,525 - $1,342,000
4
Beds
3
Baths
2,472
Sq Ft
$475/Sq Ft
Est. Value
About This Home
This home is located at 139 Weaver St, Staten Island, NY 10312 and is currently estimated at $1,173,631, approximately $474 per square foot. 139 Weaver St is a home located in Richmond County with nearby schools including P.S. 5 - Huguenot, I.S. 007 Elias Bernstein, and Tottenville High School.
Ownership History
Date
Name
Owned For
Owner Type
Purchase Details
Closed on
Aug 25, 1999
Sold by
Parascondola Joseph T and Parascondola Rose Mary
Bought by
Dejesus Paul and Petrizzo Dejesus Janine
Current Estimated Value
Home Financials for this Owner
Home Financials are based on the most recent Mortgage that was taken out on this home.
Original Mortgage
$290,000
Interest Rate
7.25%
Create a Home Valuation Report for This Property
The Home Valuation Report is an in-depth analysis detailing your home's value as well as a comparison with similar homes in the area
Home Values in the Area
Average Home Value in this Area
Purchase History
| Date | Buyer | Sale Price | Title Company |
|---|---|---|---|
| Dejesus Paul | $402,500 | Commonwealth Land Title Ins |
Source: Public Records
Mortgage History
| Date | Status | Borrower | Loan Amount |
|---|---|---|---|
| Previous Owner | Dejesus Paul | $290,000 |
Source: Public Records
Tax History Compared to Growth
Tax History
| Year | Tax Paid | Tax Assessment Tax Assessment Total Assessment is a certain percentage of the fair market value that is determined by local assessors to be the total taxable value of land and additions on the property. | Land | Improvement |
|---|---|---|---|---|
| 2025 | $11,698 | $66,540 | $17,144 | $49,396 |
| 2024 | $11,698 | $65,940 | $17,170 | $48,770 |
| 2023 | $11,159 | $54,944 | $17,117 | $37,827 |
| 2022 | $10,348 | $59,040 | $19,440 | $39,600 |
| 2021 | $10,291 | $48,900 | $19,440 | $29,460 |
| 2020 | $10,490 | $49,560 | $19,440 | $30,120 |
| 2019 | $10,196 | $52,500 | $19,440 | $33,060 |
| 2018 | $9,076 | $45,982 | $18,882 | $27,100 |
| 2017 | $8,543 | $43,380 | $19,440 | $23,940 |
| 2016 | $8,412 | $43,627 | $18,333 | $25,294 |
| 2015 | $7,534 | $43,298 | $15,692 | $27,606 |
| 2014 | $7,534 | $40,848 | $14,493 | $26,355 |
Source: Public Records
Map
Nearby Homes
- 330 Shirley Ave
- 262 Noel St
- 47 Ravenna St
- 174 Tallman St
- 207 Eylandt St
- 151 Lipsett Ave
- 21 Allen Place
- 24 Eylandt St
- 41 Bennett Place
- 62 Bennett Place
- 111 Elmbank St
- 208 Seidman Ave
- 422 Harold Ave
- 59 Newton St
- 456 Holdridge Ave
- 440 Harold Ave
- 192 Bathgate St
- 69 Elmbank St
- 155 Bathgate St
- 267 Woods of Arden Rd