139 Willow Dr Lansing, KS 66043
Estimated Value: $408,000 - $448,000
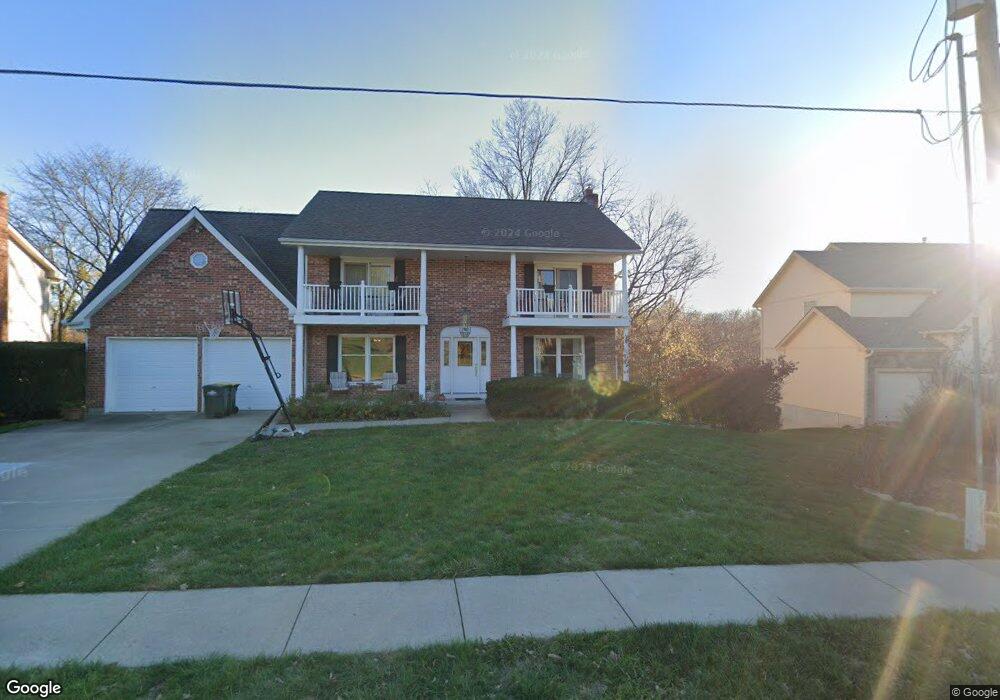
About This Home
This home is located at 139 Willow Dr, Lansing, KS 66043 and is currently estimated at $430,404, approximately $169 per square foot. 139 Willow Dr is a home located in Leavenworth County with nearby schools including Lansing Elementary School, Lansing Middle 6-8, and Lansing High 9-12.
Ownership History
We collect this data history from publicly available records. To have your information removed, we recommend requesting removal directly through your county’s website.
Purchase Details
Home Financials for this Owner
Home Financials are based on the most recent Mortgage that was taken out on this home.Home Values in the Area
Average Home Value in this Area
Purchase History
We collect this data history from publicly available records. To have your information removed, we recommend requesting removal directly through your county’s website.
| Date | Buyer | Sale Price | Title Company |
|---|---|---|---|
| $81,250 | Mccaffree-Short Title Co Inc |
Mortgage History
We collect this data history from publicly available records. To have your information removed, we recommend requesting removal directly through your county’s website.
| Date | Status | Borrower | Loan Amount |
|---|---|---|---|
| Closed | $65,000 |
Tax History
We collect this data history from publicly available records. To have your information removed, we recommend requesting removal directly through your county’s website.
| Year | Tax Paid | Tax Assessment Tax Assessment Total Assessment is a certain percentage of the fair market value that is determined by local assessors to be the total taxable value of land and additions on the property. | Land | Improvement |
|---|---|---|---|---|
| 2025 | $5,671 | $43,668 | $6,677 | $36,991 |
| 2024 | $5,255 | $41,989 | $6,677 | $35,312 |
| 2023 | $5,255 | $40,374 | $6,677 | $33,697 |
| 2022 | $5,053 | $36,703 | $4,854 | $31,849 |
| 2021 | $4,616 | $32,039 | $4,854 | $27,185 |
| 2020 | $4,504 | $30,762 | $4,854 | $25,908 |
| 2019 | $4,510 | $30,762 | $4,854 | $25,908 |
| 2018 | $4,508 | $30,762 | $4,854 | $25,908 |
| 2017 | $4,373 | $29,785 | $4,854 | $24,931 |
| 2016 | $4,375 | $29,785 | $4,854 | $24,931 |
| 2015 | $4,303 | $29,382 | $4,854 | $24,528 |
| 2014 | $4,062 | $28,328 | $4,854 | $23,474 |
Map
- 111 Southfork Rd
- 711 Willow St
- 712 Rock Creek Dr
- 107 Willow Dr
- 1052 Wyndham Dr
- 1354 Granite St
- 1313 Stone Ln
- 361 Ash Ln
- 811 4-H Rd
- 00000 W Gilman Rd
- 24870 139th St
- 13965 Mc Intyre Rd
- 13788 McIntyre1 Rd
- 13788 Mcintyre Rd
- 13788 McIntyre2 Rd
- 510 S 2nd St
- 26731 147th St
- 0 Mcintyre Rd Unit HMS2625108
- 112 W Kay St
- 202 S Main St
Ask me questions while you tour the home.