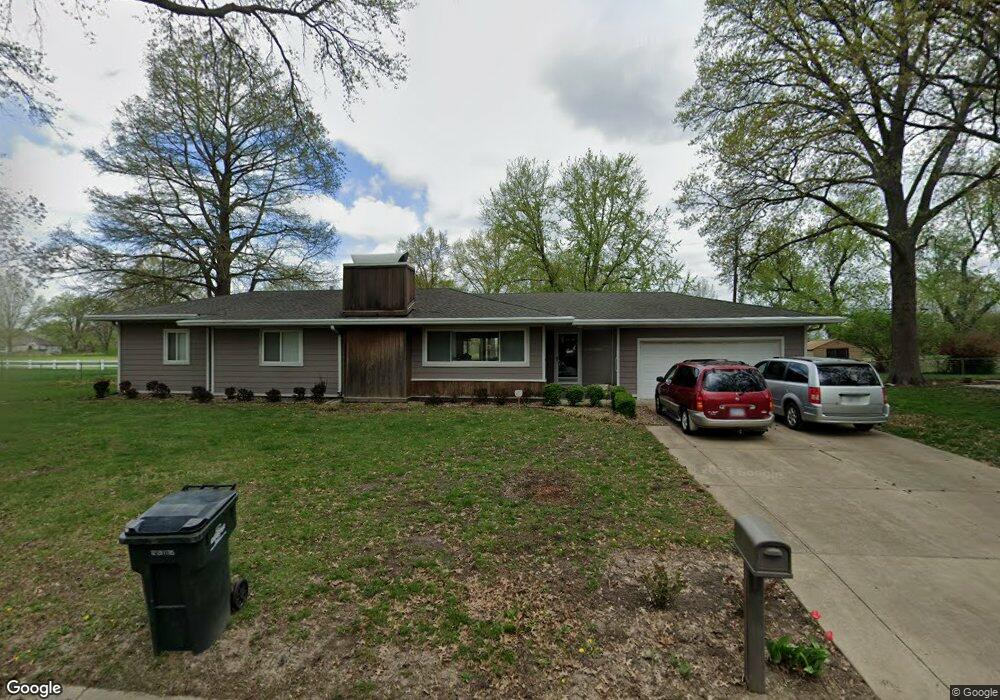
139 Woodland St Lansing, KS 66043
Estimated Value: $341,450 - $375,000
3
Beds
2
Baths
2,212
Sq Ft
$162/Sq Ft
Est. Value
About This Home
This home is located at 139 Woodland St, Lansing, KS 66043 and is currently estimated at $357,613, approximately $161 per square foot. 139 Woodland St is a home located in Leavenworth County with nearby schools including Lansing Elementary School, Lansing Middle 6-8, and Lansing High 9-12.
Ownership History
Date
Name
Owned For
Owner Type
Purchase Details
Closed on
Apr 10, 2014
Sold by
Greenamyre Jeremy M and Greenamyre Meiken
Bought by
Jones Elvin C and Jones Ellen J
Current Estimated Value
Home Financials for this Owner
Home Financials are based on the most recent Mortgage that was taken out on this home.
Original Mortgage
$186,934
Outstanding Balance
$142,479
Interest Rate
4.41%
Mortgage Type
VA
Estimated Equity
$215,134
Create a Home Valuation Report for This Property
The Home Valuation Report is an in-depth analysis detailing your home's value as well as a comparison with similar homes in the area
Home Values in the Area
Average Home Value in this Area
Purchase History
| Date | Buyer | Sale Price | Title Company |
|---|---|---|---|
| Jones Elvin C | $183,195 | Kansas Secured Title |
Source: Public Records
Mortgage History
| Date | Status | Borrower | Loan Amount |
|---|---|---|---|
| Open | Jones Elvin C | $186,934 |
Source: Public Records
Tax History Compared to Growth
Tax History
| Year | Tax Paid | Tax Assessment Tax Assessment Total Assessment is a certain percentage of the fair market value that is determined by local assessors to be the total taxable value of land and additions on the property. | Land | Improvement |
|---|---|---|---|---|
| 2025 | $4,787 | $38,134 | $5,047 | $33,087 |
| 2024 | $4,446 | $35,640 | $4,070 | $31,570 |
| 2023 | $4,446 | $34,269 | $4,070 | $30,199 |
| 2022 | $4,275 | $31,154 | $3,242 | $27,912 |
| 2021 | $4,394 | $30,510 | $3,242 | $27,268 |
| 2020 | $4,278 | $29,233 | $3,386 | $25,847 |
| 2019 | $4,071 | $27,799 | $3,386 | $24,413 |
| 2018 | $3,816 | $26,086 | $2,795 | $23,291 |
| 2017 | $3,510 | $23,970 | $2,795 | $21,175 |
| 2016 | $3,187 | $21,782 | $2,795 | $18,987 |
| 2015 | -- | $21,046 | $2,795 | $18,251 |
| 2014 | -- | $24,094 | $2,795 | $21,299 |
Source: Public Records
Map
Nearby Homes
- 268 Holiday Dr
- 415 Fairlane St
- 129 Brookwood St
- 1102 N Main St
- 218 Oak Hill St
- 4 Eisenhower Rd
- 542 Creekside Ct
- 129 Crestview Ct
- 1100 N 4th St
- 20958 Ida St
- 1102 N 4th St
- 610 Meadowlark Rd
- 603 E Beth St
- 728 Eisenhower Rd
- 124 S Main St
- 202 S Main St
- 4923 Parkway Dr
- 4915 Parkway Dr
- 813 Glenview St
- 749 Highland Dr