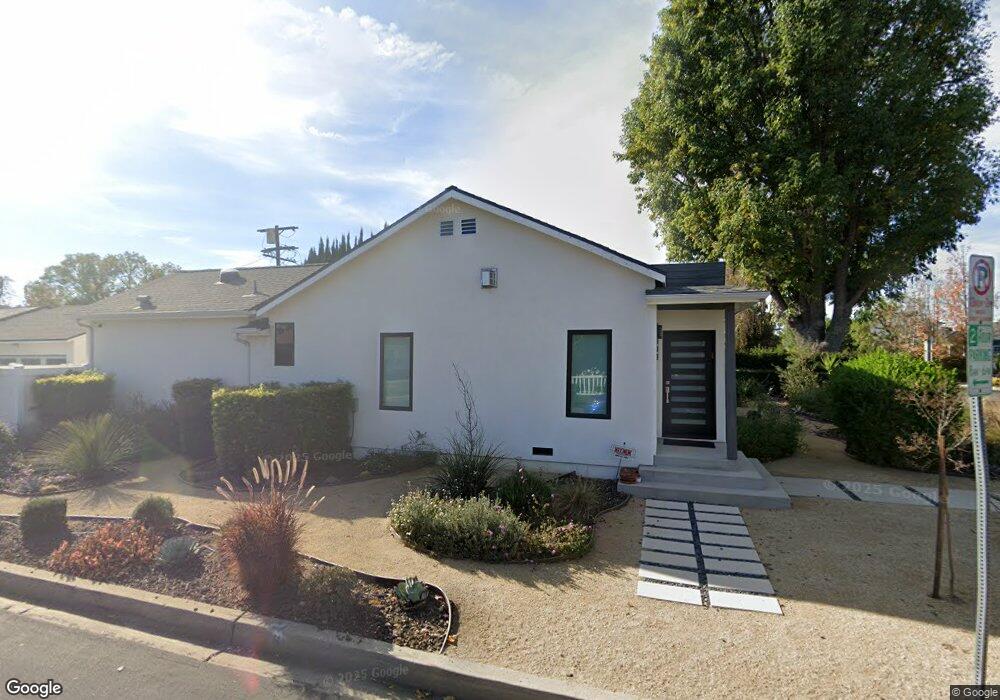
13902 Huston St Sherman Oaks, CA 91423
Estimated Value: $1,534,886 - $1,829,000
3
Beds
3
Baths
1,913
Sq Ft
$875/Sq Ft
Est. Value
About This Home
This home is located at 13902 Huston St, Sherman Oaks, CA 91423 and is currently estimated at $1,672,972, approximately $874 per square foot. 13902 Huston St is a home located in Los Angeles County with nearby schools including Chandler Elementary, Ulysses S. Grant Senior High School, and Riverside Drive Charter Elementary School.
Ownership History
Date
Name
Owned For
Owner Type
Purchase Details
Closed on
Jun 15, 2017
Sold by
Gruchala Jacqulyn and Pierstorff Donna
Bought by
Barkan Martin and Barkan Julie
Current Estimated Value
Home Financials for this Owner
Home Financials are based on the most recent Mortgage that was taken out on this home.
Original Mortgage
$275,000
Outstanding Balance
$228,050
Interest Rate
3.91%
Mortgage Type
New Conventional
Estimated Equity
$1,444,922
Purchase Details
Closed on
Sep 4, 2012
Sold by
Turner Phyllis and Turner Phyllis Vivian
Bought by
Turner Phyllis Vivian and Gruchala Jacqulyn
Create a Home Valuation Report for This Property
The Home Valuation Report is an in-depth analysis detailing your home's value as well as a comparison with similar homes in the area
Home Values in the Area
Average Home Value in this Area
Purchase History
| Date | Buyer | Sale Price | Title Company |
|---|---|---|---|
| Barkan Martin | $798,000 | First American Title Company | |
| Turner Phyllis Vivian | -- | None Available |
Source: Public Records
Mortgage History
| Date | Status | Borrower | Loan Amount |
|---|---|---|---|
| Open | Barkan Martin | $275,000 |
Source: Public Records
Tax History Compared to Growth
Tax History
| Year | Tax Paid | Tax Assessment Tax Assessment Total Assessment is a certain percentage of the fair market value that is determined by local assessors to be the total taxable value of land and additions on the property. | Land | Improvement |
|---|---|---|---|---|
| 2025 | $12,253 | $1,016,454 | $726,387 | $290,067 |
| 2024 | $12,253 | $996,525 | $712,145 | $284,380 |
| 2023 | $12,016 | $976,986 | $698,182 | $278,804 |
| 2022 | $11,455 | $957,831 | $684,493 | $273,338 |
| 2021 | $11,313 | $939,051 | $671,072 | $267,979 |
| 2019 | $10,973 | $911,200 | $651,168 | $260,032 |
| 2018 | $9,712 | $798,000 | $638,400 | $159,600 |
| 2016 | $1,124 | $82,384 | $38,085 | $44,299 |
| 2015 | $1,109 | $81,147 | $37,513 | $43,634 |
| 2014 | $1,123 | $79,559 | $36,779 | $42,780 |
Source: Public Records
Map
Nearby Homes
- 13935 Huston St
- 14000 Morrison St
- 5003 Mammoth Ave
- 13925 Branton Place
- 4824 Calhoun Ave
- 14050 Magnolia Blvd Unit 316
- 14011 Magnolia Blvd
- 4846 Katherine Ave
- 13905 Milbank St
- 4710 Ventura Canyon Ave
- 4487 Colbath Ave Unit 310
- 4487 Colbath Ave Unit 207
- 4487 Colbath Ave Unit 101
- 4616 Ventura Canyon Ave
- 4532 Calhoun Ave
- 4477 Woodman Ave Unit 304
- 4915 Tyrone Ave Unit 102
- 14315 Riverside Dr Unit 105
- 5249 Ventura Canyon Ave
- 5116 Sunnyslope Ave
- 13910 Huston St
- 13903 Peach Grove St
- 13909 Peach Grove St
- 13916 Huston St
- 4906 Ranchito Ave
- 4912 Ranchito Ave
- 13917 Peach Grove St
- 13903 Huston St
- 4900 Ranchito Ave
- 13909 Huston St
- 4918 Ranchito Ave
- 13922 Huston St
- 13917 Huston St
- 13923 Peach Grove St
- 4924 Ranchito Ave
- 13923 Huston St
- 13928 Huston St
- 4907 Stern Ave
- 4848 Ranchito Ave
- 4913 Stern Ave