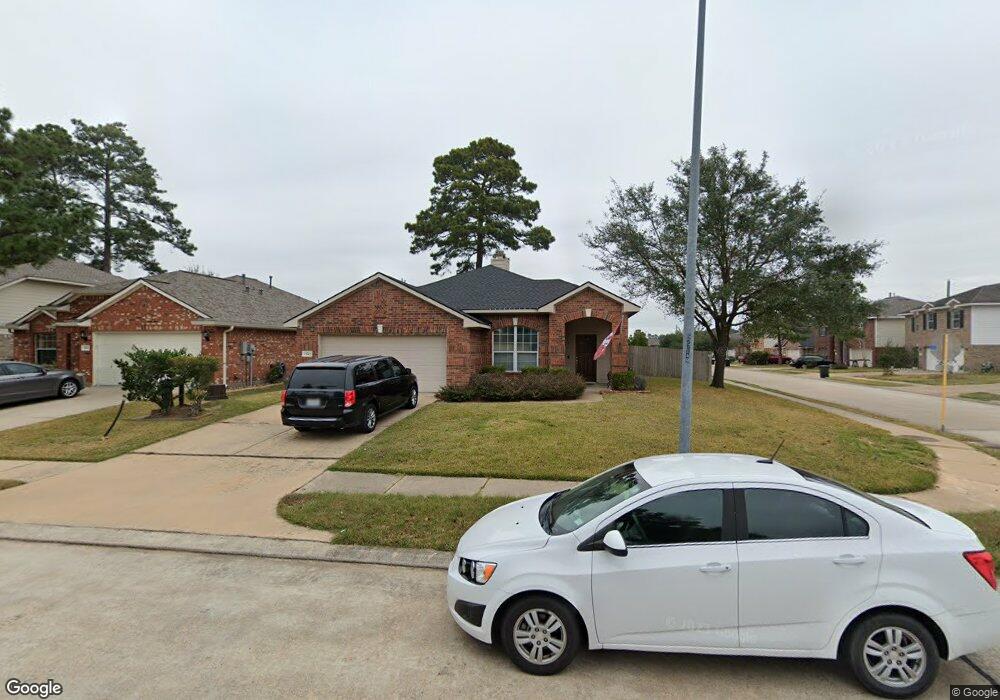
13902 Tribe Dr Cypress, TX 77429
Northpointe NeighborhoodEstimated Value: $300,000 - $314,000
3
Beds
2
Baths
1,944
Sq Ft
$158/Sq Ft
Est. Value
About This Home
This home is located at 13902 Tribe Dr, Cypress, TX 77429 and is currently estimated at $307,546, approximately $158 per square foot. 13902 Tribe Dr is a home located in Harris County with nearby schools including Wildwood Elementary School, Oakcrest Intermediate School, and Tomball Memorial High School.
Ownership History
Date
Name
Owned For
Owner Type
Purchase Details
Closed on
Jul 15, 2016
Sold by
Singh Shobana K
Bought by
Lopez Jose Martian and Lopez Lizette Sanchez
Current Estimated Value
Home Financials for this Owner
Home Financials are based on the most recent Mortgage that was taken out on this home.
Original Mortgage
$179,685
Outstanding Balance
$141,897
Interest Rate
3.25%
Mortgage Type
FHA
Estimated Equity
$165,649
Purchase Details
Closed on
Aug 11, 2011
Sold by
Brautigam Matthew H and Brautigam Amanda H
Bought by
Singh Shobna K
Purchase Details
Closed on
Nov 18, 2005
Sold by
Indian Trails Lp
Bought by
Brautigam Matthew H and Scott Amanda J
Home Financials for this Owner
Home Financials are based on the most recent Mortgage that was taken out on this home.
Original Mortgage
$138,362
Interest Rate
6.04%
Mortgage Type
FHA
Create a Home Valuation Report for This Property
The Home Valuation Report is an in-depth analysis detailing your home's value as well as a comparison with similar homes in the area
Home Values in the Area
Average Home Value in this Area
Purchase History
| Date | Buyer | Sale Price | Title Company |
|---|---|---|---|
| Lopez Jose Martian | -- | Capital Title | |
| Singh Shobna K | -- | Stewart Title | |
| Brautigam Matthew H | -- | Premier Title Co |
Source: Public Records
Mortgage History
| Date | Status | Borrower | Loan Amount |
|---|---|---|---|
| Open | Lopez Jose Martian | $179,685 | |
| Previous Owner | Brautigam Matthew H | $138,362 |
Source: Public Records
Tax History
| Year | Tax Paid | Tax Assessment Tax Assessment Total Assessment is a certain percentage of the fair market value that is determined by local assessors to be the total taxable value of land and additions on the property. | Land | Improvement |
|---|---|---|---|---|
| 2025 | $6,289 | $304,957 | $56,350 | $248,607 |
| 2024 | $6,289 | $304,782 | $53,990 | $250,792 |
| 2023 | $6,289 | $322,145 | $53,990 | $268,155 |
| 2022 | $6,708 | $287,575 | $45,434 | $242,141 |
| 2021 | $6,320 | $229,272 | $41,304 | $187,968 |
| 2020 | $5,973 | $208,953 | $41,304 | $167,649 |
| 2019 | $6,140 | $208,953 | $31,568 | $177,385 |
| 2018 | $2,213 | $190,159 | $31,568 | $158,591 |
| 2017 | $5,615 | $190,159 | $31,568 | $158,591 |
| 2016 | $5,387 | $182,423 | $31,568 | $150,855 |
| 2015 | $4,311 | $182,423 | $31,568 | $150,855 |
| 2014 | $4,311 | $164,521 | $31,568 | $132,953 |
Source: Public Records
Map
Nearby Homes
- 13927 Tribe Dr
- 14503 Hueco Mountain Dr
- 14523 Cobalt Bend Trail
- 14715 Oakheath River Ct
- 13830 Pawnee Trails Dr
- 13539 Astley Acres Ln
- 13603 Sandford Meadow Ln
- 14230 Englewood Park Ln
- 14142 Sunrise Arbor Ln
- 14415 Leaning Aspen Ct
- 14102 Pawnee Bend Dr
- 13310 Cypress Palms Ct
- 13302 Rising Bluff Ln
- 13910 Little Rock Ct
- 0 Grant Rd Unit 28544274
- 13915 Springmint Dr
- 17903 Rushing Hollow Ct
- 13707 Pegasus Rd
- 15203 Gentle Breeze Ct
- 13315 Edison Trace Ln
- 13918 Tribe Dr
- 13906 Tribe Dr
- 13910 Tribe Dr
- 13903 Roanoke Falls Dr
- 13907 Roanoke Falls Dr
- 14506 Santee Pass Dr
- 13911 Roanoke Falls Dr
- 14502 Santee Pass Dr
- 14514 Santee Pass Dr
- 13914 Tribe Dr
- 14570 Santee Pass Dr
- 13903 Tribe Dr
- 13907 Tribe Dr
- 13915 Roanoke Falls Dr
- 13911 Tribe Dr
- 14446 Santee Pass Dr
- 13919 Roanoke Falls Dr
- 14518 Santee Pass Dr
- 13915 Tribe Dr
- 14442 Santee Pass Dr
Your Personal Tour Guide
Ask me questions while you tour the home.