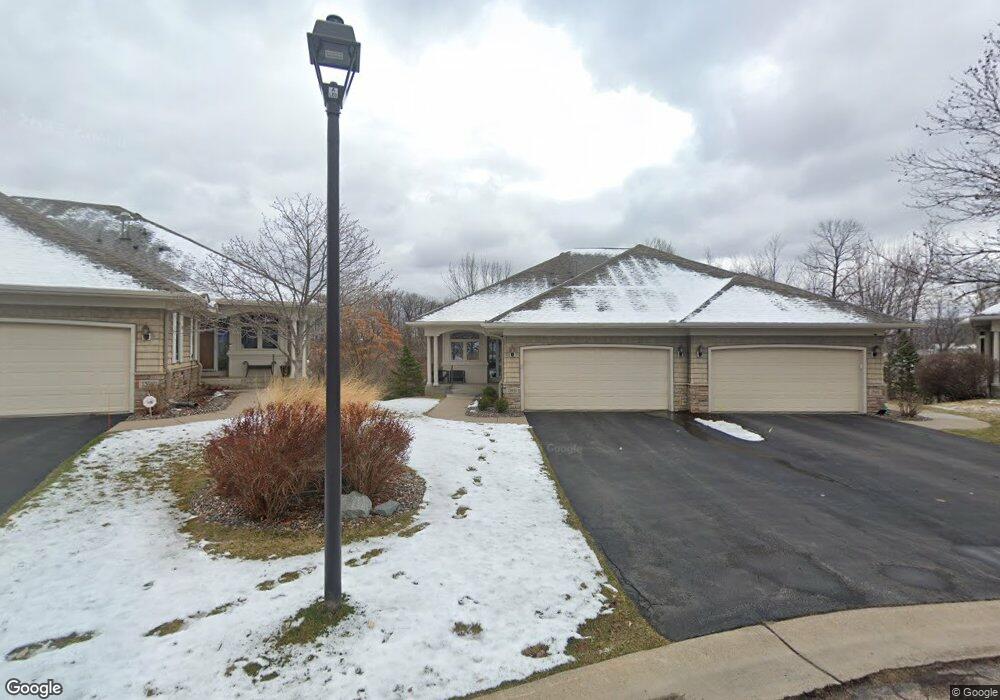
13904 45th Ave N Plymouth, MN 55446
Estimated Value: $543,000 - $623,000
3
Beds
3
Baths
2,764
Sq Ft
$211/Sq Ft
Est. Value
About This Home
This home is located at 13904 45th Ave N, Plymouth, MN 55446 and is currently estimated at $581,823, approximately $210 per square foot. 13904 45th Ave N is a home located in Hennepin County with nearby schools including Zachary Lane Elementary School, Plymouth Middle School, and Armstrong High School.
Ownership History
Date
Name
Owned For
Owner Type
Purchase Details
Closed on
Nov 16, 2022
Sold by
Pankonin Bruce L and Pankonin Elizabeth A
Bought by
Pankonin Bruce L and Pankonin Elizabeth A
Current Estimated Value
Purchase Details
Closed on
Jun 22, 2022
Sold by
Spah Jeffrey and Spah Nicole
Bought by
Pankonin Bruce and Pankonin Elizabeth
Purchase Details
Closed on
Jun 20, 2022
Sold by
Spah Jeffrey R and Spah Nicole M
Bought by
Pankonin Bruce and Pankonin Elizabeth
Purchase Details
Closed on
Sep 25, 2017
Sold by
Thies Lyle A and Joy Ce E
Bought by
Spah Jeffrey R and Spah Nicole M
Home Financials for this Owner
Home Financials are based on the most recent Mortgage that was taken out on this home.
Original Mortgage
$402,800
Interest Rate
3.89%
Mortgage Type
New Conventional
Purchase Details
Closed on
Jul 31, 2008
Sold by
Vinje Craig D and Klager Martha
Bought by
Thies Lyle A and Thies Joyce
Purchase Details
Closed on
Oct 29, 2004
Sold by
Svk Development Inc
Bought by
Vinje Craig D
Create a Home Valuation Report for This Property
The Home Valuation Report is an in-depth analysis detailing your home's value as well as a comparison with similar homes in the area
Home Values in the Area
Average Home Value in this Area
Purchase History
| Date | Buyer | Sale Price | Title Company |
|---|---|---|---|
| Pankonin Bruce L | -- | None Listed On Document | |
| Pankonin Bruce | $600,500 | -- | |
| Pankonin Bruce | $600,500 | Edina Realty Title | |
| Spah Jeffrey R | $424,000 | Tredmark Title Services Inc | |
| Thies Lyle A | $413,500 | -- | |
| Vinje Craig D | $498,233 | -- |
Source: Public Records
Mortgage History
| Date | Status | Borrower | Loan Amount |
|---|---|---|---|
| Previous Owner | Spah Jeffrey R | $402,800 |
Source: Public Records
Tax History Compared to Growth
Tax History
| Year | Tax Paid | Tax Assessment Tax Assessment Total Assessment is a certain percentage of the fair market value that is determined by local assessors to be the total taxable value of land and additions on the property. | Land | Improvement |
|---|---|---|---|---|
| 2024 | $6,288 | $529,400 | $156,200 | $373,200 |
| 2023 | $6,100 | $533,600 | $154,000 | $379,600 |
| 2022 | $5,422 | $522,000 | $154,000 | $368,000 |
| 2021 | $5,336 | $442,000 | $127,000 | $315,000 |
| 2020 | $5,578 | $433,000 | $127,000 | $306,000 |
| 2019 | $5,598 | $438,000 | $114,000 | $324,000 |
| 2018 | $5,180 | $418,000 | $109,000 | $309,000 |
| 2017 | $5,302 | $387,000 | $101,000 | $286,000 |
| 2016 | $5,464 | $378,000 | $99,000 | $279,000 |
| 2015 | $5,239 | $359,800 | $94,100 | $265,700 |
| 2014 | -- | $354,200 | $94,100 | $260,100 |
Source: Public Records
Map
Nearby Homes
- 14004 45th Ave N
- 14210 44th Place N Unit 6
- 4825 Underwood Ln N Unit F
- 4940 Underwood Ln N Unit 4940I
- 4615 Juneau Ln N
- 4810 Juneau Ln N
- 13025 44th Ave N
- 4130 Glacier Ln N
- 14625 43rd Ave N
- 14004 52nd Ave N
- 13848 52nd Ave N
- 15025 48th Ave N
- 13876 52nd Ave N
- 13888 52nd Ave N
- 13829 54th Ave N
- 4130 Minnesota Ln N
- 14650 40th Place N
- 5160 Juneau Ln N
- 12755 42nd Place N
- 12610 42nd Place N
- 13900 45th Ave N
- 13910 45th Ave N
- 13914 45th Ave N
- 13905 45th Ave N
- 13920 45th Ave N
- 13911 45th Ave N
- 13924 45th Ave N
- 13915 45th Ave N
- 13930 45th Ave N
- 13921 45th Ave N
- 13934 45th Ave N
- 14000 45th Ave N
- 13925 45th Ave N
- 14001 45th Ave N
- 14010 45th Ave N
- 14005 45th Ave N
- 14014 45th Ave N
- 14011 45th Ave N
- 4600 Dallas Ln N
- 14021 45th Ave N