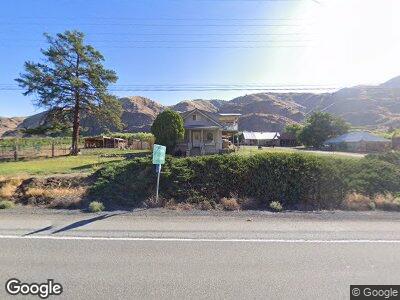
13904 State Route 2 Orondo, WA 98843
Estimated Value: $258,000 - $689,000
3
Beds
2
Baths
1,720
Sq Ft
$279/Sq Ft
Est. Value
About This Home
This home is located at 13904 State Route 2, Orondo, WA 98843 and is currently estimated at $479,172, approximately $278 per square foot. 13904 State Route 2 is a home located in Douglas County with nearby schools including Orondo Elementary/Middle School.
Ownership History
Date
Name
Owned For
Owner Type
Purchase Details
Closed on
Sep 14, 2017
Sold by
Johnson Deborah
Bought by
Winkel Brandy I and Winkel Wiliam W
Current Estimated Value
Home Financials for this Owner
Home Financials are based on the most recent Mortgage that was taken out on this home.
Original Mortgage
$100,000
Interest Rate
3.89%
Mortgage Type
Credit Line Revolving
Purchase Details
Closed on
Sep 1, 2017
Sold by
Johnson Deborah
Bought by
Winkel Brandy I and Winkel William W
Home Financials for this Owner
Home Financials are based on the most recent Mortgage that was taken out on this home.
Original Mortgage
$100,000
Interest Rate
3.89%
Mortgage Type
Credit Line Revolving
Purchase Details
Closed on
Aug 31, 2017
Sold by
Johnson Cort
Bought by
Johnson Deborah
Home Financials for this Owner
Home Financials are based on the most recent Mortgage that was taken out on this home.
Original Mortgage
$100,000
Interest Rate
3.89%
Mortgage Type
Credit Line Revolving
Create a Home Valuation Report for This Property
The Home Valuation Report is an in-depth analysis detailing your home's value as well as a comparison with similar homes in the area
Home Values in the Area
Average Home Value in this Area
Purchase History
| Date | Buyer | Sale Price | Title Company |
|---|---|---|---|
| Winkel Brandy I | -- | None Available | |
| Johnson Deborah | -- | None Available | |
| Winkel Brandy I | -- | None Available | |
| Johnson Deborah | -- | None Available |
Source: Public Records
Mortgage History
| Date | Status | Borrower | Loan Amount |
|---|---|---|---|
| Open | Winkel Brandy I | $165,000 | |
| Closed | Winkel Brandy I | $100,000 | |
| Previous Owner | Johnson Deborah | $70,000 | |
| Previous Owner | Land Title Company Citifinancial Inc | $51,589 | |
| Previous Owner | Johnson Cort | $4,012,020 |
Source: Public Records
Tax History Compared to Growth
Tax History
| Year | Tax Paid | Tax Assessment Tax Assessment Total Assessment is a certain percentage of the fair market value that is determined by local assessors to be the total taxable value of land and additions on the property. | Land | Improvement |
|---|---|---|---|---|
| 2025 | $1,677 | $242,500 | $96,300 | $146,200 |
| 2024 | $1,677 | $247,900 | $96,300 | $151,600 |
| 2023 | $1,870 | $248,100 | $96,300 | $151,800 |
| 2022 | $1,334 | $155,900 | $50,000 | $105,900 |
| 2021 | $1,307 | $155,900 | $50,000 | $105,900 |
| 2020 | $1,283 | $155,900 | $50,000 | $105,900 |
| 2018 | $1,407 | $156,800 | $50,000 | $106,800 |
| 2017 | $1,210 | $156,800 | $50,000 | $106,800 |
| 2016 | $1,219 | $138,600 | $50,000 | $88,600 |
| 2015 | $1,308 | $138,600 | $50,000 | $88,600 |
| 2014 | -- | $138,600 | $50,000 | $88,600 |
| 2013 | -- | $135,100 | $50,000 | $85,100 |
Source: Public Records
Map
Nearby Homes
- 6 XX Chipmunk Trail
- 66 Coyote Ln
- 3 Tyee View Loop
- 103 Fir Rd
- 0 Fisher Ln
- 25 Corral Ln
- 0 Entiat River Rd Unit NWM2340501
- 13397 State Rd
- 24 Mile Entiat River Rd
- 106 Falcon Ridge Rd
- 208 Falcon Ridge Rd
- 98 Tyee View Loop Rd
- 13555 Hillcrest Dr
- 420 Hummingbird Rd
- 9988 Saska Way
- 9955 Griffith Place
- 2391 Albin Dr
- 0 Deer Creek Dr Unit NWM2294724
- 1010 Crest Loop
- 1017 Crest Loop
- 13904 State Route 2
- 13914 State Route 2
- 0 Us 97 Unit 1222369
- 0 Us 97 Unit 995125
- 0 Us 97 Unit 994556
- 0 Us 97 Unit Lt1-2 1631044
- 0 Us 97 Unit 1630389
- 0 Us 97 Unit 1466515
- 0 Us 97 Unit 1466496
- 0 Us 97 Unit 1466475
- 0 Us 97 Unit 1466306
- 0 Us 97 Unit 1383818
- 13888 State Route 2
- 4 Playland Ct
- 2 Playland Ct
- 3 W Rocky Rd
- 9 W Rocky Road Dr
- 9 W Rocky Rd
- 15 Rocky Rd
- 11 W Rocky Rd