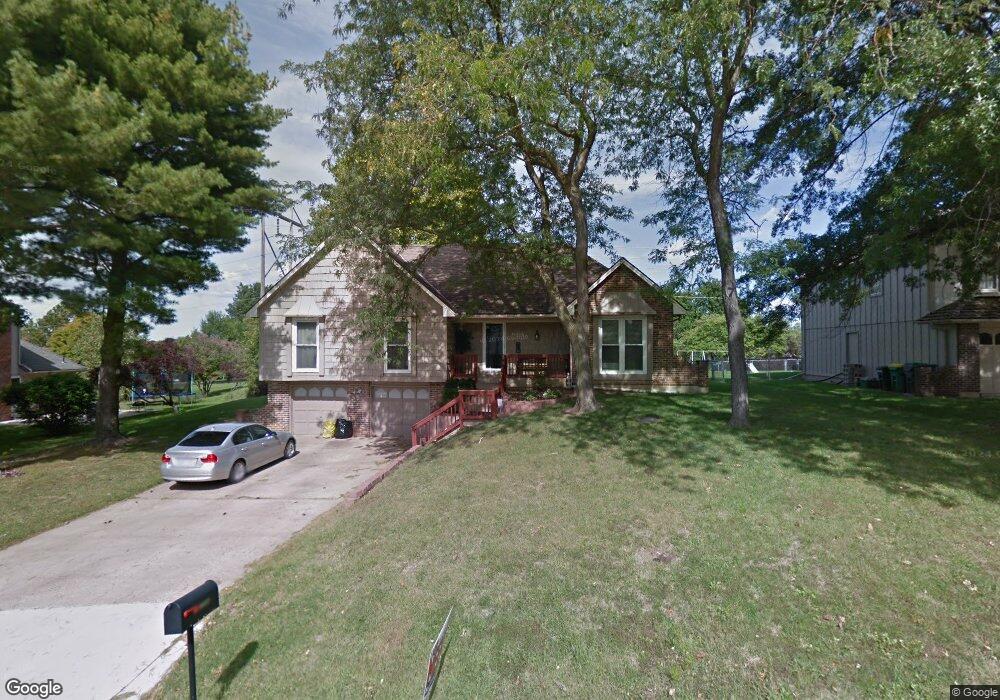
13906 W 69th St Shawnee, KS 66216
Estimated Value: $370,000 - $378,000
4
Beds
2
Baths
1,776
Sq Ft
$211/Sq Ft
Est. Value
About This Home
This home is located at 13906 W 69th St, Shawnee, KS 66216 and is currently estimated at $373,866, approximately $210 per square foot. 13906 W 69th St is a home located in Johnson County with nearby schools including Rhein Benninghoven Elementary School, Trailridge Middle School, and Shawnee Mission Northwest High School.
Ownership History
Date
Name
Owned For
Owner Type
Purchase Details
Closed on
Apr 12, 2022
Sold by
Zeit Storey Lee Ann
Bought by
Zeit Christopher C
Current Estimated Value
Home Financials for this Owner
Home Financials are based on the most recent Mortgage that was taken out on this home.
Original Mortgage
$140,000
Interest Rate
4.72%
Mortgage Type
New Conventional
Purchase Details
Closed on
May 5, 2006
Sold by
Zimmermann Cynthia A and Malnar Beverly J
Bought by
Zeit Lee A and Zeit Christopher C
Home Financials for this Owner
Home Financials are based on the most recent Mortgage that was taken out on this home.
Original Mortgage
$175,612
Interest Rate
2.25%
Mortgage Type
Adjustable Rate Mortgage/ARM
Purchase Details
Closed on
Jan 4, 2006
Sold by
Brown Kathy A
Bought by
Zimmermann Cynthia A and Malnar Beverly J
Home Financials for this Owner
Home Financials are based on the most recent Mortgage that was taken out on this home.
Original Mortgage
$87,500
Interest Rate
6.23%
Mortgage Type
New Conventional
Create a Home Valuation Report for This Property
The Home Valuation Report is an in-depth analysis detailing your home's value as well as a comparison with similar homes in the area
Home Values in the Area
Average Home Value in this Area
Purchase History
| Date | Buyer | Sale Price | Title Company |
|---|---|---|---|
| Zeit Christopher C | -- | Hale Leila H | |
| Zeit Christopher C | -- | None Listed On Document | |
| Zeit Lee A | -- | Kansas City Title | |
| Zimmermann Cynthia A | -- | Kansas City Title |
Source: Public Records
Mortgage History
| Date | Status | Borrower | Loan Amount |
|---|---|---|---|
| Previous Owner | Zeit Christopher C | $140,000 | |
| Previous Owner | Zeit Lee A | $175,612 | |
| Previous Owner | Zimmermann Cynthia A | $87,500 |
Source: Public Records
Tax History Compared to Growth
Tax History
| Year | Tax Paid | Tax Assessment Tax Assessment Total Assessment is a certain percentage of the fair market value that is determined by local assessors to be the total taxable value of land and additions on the property. | Land | Improvement |
|---|---|---|---|---|
| 2024 | $3,947 | $37,364 | $6,729 | $30,635 |
| 2023 | $3,946 | $36,812 | $6,729 | $30,083 |
| 2022 | $3,515 | $32,683 | $5,847 | $26,836 |
| 2021 | $3,472 | $30,268 | $5,315 | $24,953 |
| 2020 | $3,253 | $27,980 | $4,830 | $23,150 |
| 2019 | $3,020 | $25,944 | $4,388 | $21,556 |
| 2018 | $2,903 | $24,840 | $4,388 | $20,452 |
| 2017 | $2,806 | $23,632 | $3,812 | $19,820 |
| 2016 | $2,628 | $21,838 | $3,812 | $18,026 |
| 2015 | $2,372 | $20,504 | $3,812 | $16,692 |
| 2013 | -- | $19,308 | $3,812 | $15,496 |
Source: Public Records
Map
Nearby Homes
- 7029 Albervan St
- 6640 Pflumm Rd
- 13415 W 66th Terrace
- 13903 W 71st Place
- 14406 W 65th Terrace
- 12914 W 67th St
- 7105 Richards Dr
- 13100 W 72nd St
- 6942 Constance St
- 7115 Richards Dr
- 7325 Oakview St
- 14204 W 63rd St
- 14214 W 63rd St
- 13800 W 75th Ct
- Augusta Plan at Kenneth Estates
- Newport Plan at Kenneth Estates
- Rosemount II Plan at Kenneth Estates
- The Avala Villa Plan at Kenneth Estates
- The Rosemount Villa Plan at Kenneth Estates
- Catalina II Plan at Kenneth Estates
- 13900 W 69th St
- 6839 Cottonwood Dr
- 13814 W 69th St
- 13905 W 69th St
- 13901 W 69th St
- 6901 Cottonwood Dr
- 13817 W 68th St
- 13813 W 68th St
- 13815 W 69th St
- 14004 W 69th St
- 6811 Cottonwood Dr
- 13811 W 69th St
- 13818 W 68th St
- 6900 Cottonwood Dr
- 13806 W 69th St
- 13904 W 69th Terrace
- 13809 W 68th St
- 13900 W 69th Terrace
- 6905 Cottonwood Dr
- 14008 W 69th St