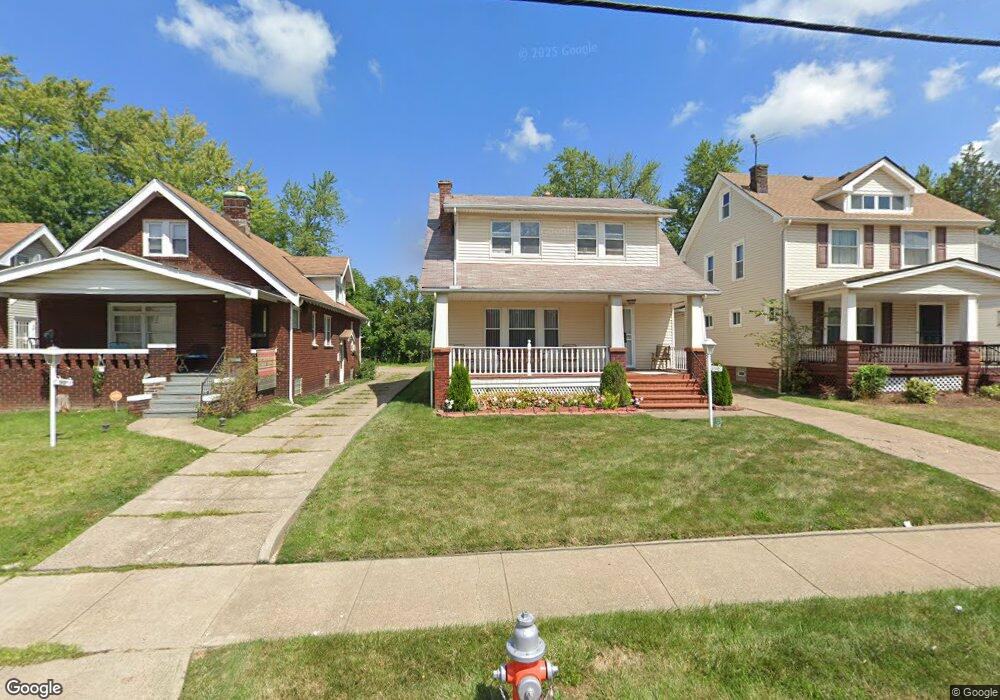
13909 Bartlett Ave Cleveland, OH 44120
Mount Pleasant NeighborhoodEstimated Value: $91,000 - $104,000
5
Beds
2
Baths
1,860
Sq Ft
$51/Sq Ft
Est. Value
About This Home
This home is located at 13909 Bartlett Ave, Cleveland, OH 44120 and is currently estimated at $95,066, approximately $51 per square foot. 13909 Bartlett Ave is a home located in Cuyahoga County with nearby schools including Andrew J. Rickoff School, Adlai Stevenson School, and Anton Grdina School.
Ownership History
Date
Name
Owned For
Owner Type
Purchase Details
Closed on
Mar 10, 2007
Sold by
Anderson Myrna and Edmonds Michelle
Bought by
Anders3n Myrna and Edmonds Michelle
Current Estimated Value
Home Financials for this Owner
Home Financials are based on the most recent Mortgage that was taken out on this home.
Original Mortgage
$96,000
Outstanding Balance
$57,884
Interest Rate
6.19%
Mortgage Type
New Conventional
Estimated Equity
$37,182
Purchase Details
Closed on
Feb 24, 2004
Sold by
Estate Of John H Edmonds Jr
Bought by
Anderson Myrna and Edmonds Michelle
Purchase Details
Closed on
Sep 14, 2002
Sold by
Gladney Jonella
Bought by
Edmonds John H
Purchase Details
Closed on
Sep 6, 2000
Sold by
Edmonds John H
Bought by
Edmonds John H and Gladney Jonella
Purchase Details
Closed on
Aug 3, 2000
Sold by
Estate Of Muriel I Edmonds
Bought by
Edmonds John H
Purchase Details
Closed on
Jan 1, 1975
Bought by
Edmonds John H and Edmonds Muriel I
Create a Home Valuation Report for This Property
The Home Valuation Report is an in-depth analysis detailing your home's value as well as a comparison with similar homes in the area
Home Values in the Area
Average Home Value in this Area
Purchase History
| Date | Buyer | Sale Price | Title Company |
|---|---|---|---|
| Anders3n Myrna | -- | Attorney | |
| Anderson Myrna | -- | -- | |
| Edmonds John H | -- | -- | |
| Edmonds John H | -- | -- | |
| Edmonds John H | -- | -- | |
| Edmonds John H | -- | -- |
Source: Public Records
Mortgage History
| Date | Status | Borrower | Loan Amount |
|---|---|---|---|
| Open | Anders3n Myrna | $96,000 |
Source: Public Records
Tax History Compared to Growth
Tax History
| Year | Tax Paid | Tax Assessment Tax Assessment Total Assessment is a certain percentage of the fair market value that is determined by local assessors to be the total taxable value of land and additions on the property. | Land | Improvement |
|---|---|---|---|---|
| 2024 | $1,601 | $24,430 | $3,780 | $20,650 |
| 2023 | $1,157 | $15,260 | $2,520 | $12,740 |
| 2022 | $1,151 | $15,260 | $2,520 | $12,740 |
| 2021 | $1,139 | $15,260 | $2,520 | $12,740 |
| 2020 | $1,136 | $13,160 | $2,170 | $10,990 |
| 2019 | $1,051 | $37,600 | $6,200 | $31,400 |
| 2018 | $1,033 | $13,160 | $2,170 | $10,990 |
| 2017 | $1,027 | $12,460 | $2,030 | $10,430 |
| 2016 | $1,020 | $12,460 | $2,030 | $10,430 |
| 2015 | $1,023 | $12,460 | $2,030 | $10,430 |
| 2014 | $1,023 | $12,460 | $2,030 | $10,430 |
Source: Public Records
Map
Nearby Homes
- 13617 Horner Ave
- 3698 E 143rd St
- 3640 E 138th St
- 13710 Coath Ave
- 3628 E 142nd St
- 13317 Coath Ave
- 3613 E 135th St
- 13505 Southview Ave
- 3602 E 138th St
- 3634 E 143rd St
- 13305 Coath Ave
- 3846 E 143rd St
- 3778 E 146th St
- 3606 E 143rd St
- 3833 E 144th St
- 3582 E 140th St
- 13205 Southview Ave
- 13201 Southview Ave
- 3552 E 138th St
- 3846 E 146th St
- 13905 Bartlett Ave
- 13913 Bartlett Ave
- 13901 Bartlett Ave
- 13917 Bartlett Ave
- 13829 Bartlett Ave
- 13906 Melzer Ave
- 13910 Melzer Ave
- 13902 Melzer Ave
- 13825 Bartlett Ave
- 13834 Melzer Ave
- 13912 Melzer Ave
- 3734 E 140th St
- 3742 E 140th St
- 13830 Melzer Ave
- 3730 E 140th St
- 13910 Bartlett Ave
- 13914 Bartlett Ave
- 13906 Bartlett Ave
- 13823 Bartlett Ave
- 3726 E 140th St