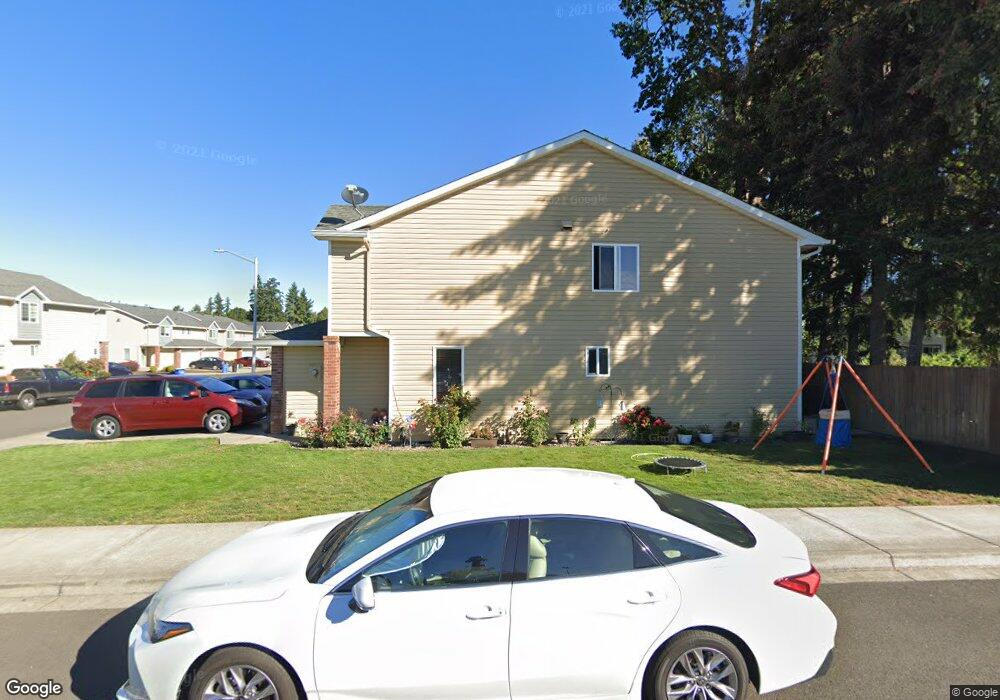
13909 NE 7th Ct Vancouver, WA 98685
Knapp NeighborhoodEstimated Value: $363,000 - $400,842
3
Beds
3
Baths
1,491
Sq Ft
$260/Sq Ft
Est. Value
About This Home
This home is located at 13909 NE 7th Ct, Vancouver, WA 98685 and is currently estimated at $387,461, approximately $259 per square foot. 13909 NE 7th Ct is a home located in Clark County with nearby schools including Chinook Elementary School, Alki Middle School, and Skyview High School.
Ownership History
Date
Name
Owned For
Owner Type
Purchase Details
Closed on
Mar 22, 2018
Sold by
Terrazas Rick G
Bought by
Terrazas Ricky G and Terrazas Marta A
Current Estimated Value
Home Financials for this Owner
Home Financials are based on the most recent Mortgage that was taken out on this home.
Original Mortgage
$134,900
Outstanding Balance
$78,460
Interest Rate
4.4%
Mortgage Type
New Conventional
Estimated Equity
$309,001
Purchase Details
Closed on
Jul 20, 2006
Sold by
Hannah Heidi L
Bought by
Terrazas Rick G
Home Financials for this Owner
Home Financials are based on the most recent Mortgage that was taken out on this home.
Original Mortgage
$28,950
Interest Rate
6.69%
Mortgage Type
Credit Line Revolving
Purchase Details
Closed on
Nov 7, 2003
Sold by
Waterford Development Llc
Bought by
Hannah Heidi L
Create a Home Valuation Report for This Property
The Home Valuation Report is an in-depth analysis detailing your home's value as well as a comparison with similar homes in the area
Home Values in the Area
Average Home Value in this Area
Purchase History
| Date | Buyer | Sale Price | Title Company |
|---|---|---|---|
| Terrazas Ricky G | -- | Chicago Title Fishers Landin | |
| Terrazas Rick G | $193,000 | Cascade Title | |
| Hannah Heidi L | -- | First American Title |
Source: Public Records
Mortgage History
| Date | Status | Borrower | Loan Amount |
|---|---|---|---|
| Open | Terrazas Ricky G | $134,900 | |
| Closed | Terrazas Rick G | $28,950 | |
| Closed | Terrazas Rick G | $154,400 |
Source: Public Records
Tax History Compared to Growth
Tax History
| Year | Tax Paid | Tax Assessment Tax Assessment Total Assessment is a certain percentage of the fair market value that is determined by local assessors to be the total taxable value of land and additions on the property. | Land | Improvement |
|---|---|---|---|---|
| 2025 | $3,404 | $363,931 | $174,800 | $189,131 |
| 2024 | $3,120 | $325,928 | $174,800 | $151,128 |
| 2023 | $3,446 | $335,250 | $180,500 | $154,750 |
| 2022 | $2,929 | $356,519 | $180,500 | $176,019 |
| 2021 | $2,723 | $269,448 | $122,500 | $146,948 |
| 2020 | $2,562 | $234,859 | $92,191 | $142,668 |
| 2019 | $2,418 | $235,343 | $88,740 | $146,603 |
| 2018 | $2,585 | $230,031 | $0 | $0 |
| 2017 | $2,223 | $204,881 | $0 | $0 |
| 2016 | $2,048 | $183,378 | $0 | $0 |
| 2015 | $2,047 | $157,771 | $0 | $0 |
| 2014 | -- | $152,594 | $0 | $0 |
| 2013 | -- | $132,194 | $0 | $0 |
Source: Public Records
Map
Nearby Homes
- 14204 NE 10th Ave
- 13419 NE 6th Ct
- 14411 NE 8th Ct
- 1207 NE Knowles Dr
- 14217 NE 10th Ave
- 1317 NE 143rd St
- 911 NE Tenney Rd
- 1305 NE Knowles Dr
- 304 NE 148th St
- 306 NW 134th St
- 1312 NE 131st Cir
- 207 NW 150th Way
- 215 NW 150th Way
- 1716 NE 146th St
- 309 NW 150th Way
- 15020 NW 1st Ave
- 508 NE 127th St
- 12704 NE 11th Place
- 13846 NW 10th Ct
- 13821 NW 10th Ct Unit H
- 13911 NE 7th Ct
- 13915 NE 7th Ct
- 13917 NE 7th Ct
- 702 NE 139th St
- 13902 NE 7th Ct
- 13919 NE 7th Ct
- 13910 NE 7th Ct
- 13912 NE 7th Place
- 13905 NE 7th Ct
- 602 NE 139th St
- 13916 NE 7th Ct
- 13921 NE 7th Ct
- 13923 NE 7th Ct
- 13904 NE 7th Ct
- 14002 NE 7th Place
- 13920 NE 7th Ct
- 13922 NE 7th Ct
- 13922 NE 7th Ct Unit Bacara Townhouse
- 13922 NE 7th Ct
- 13901 NE 7th Ct