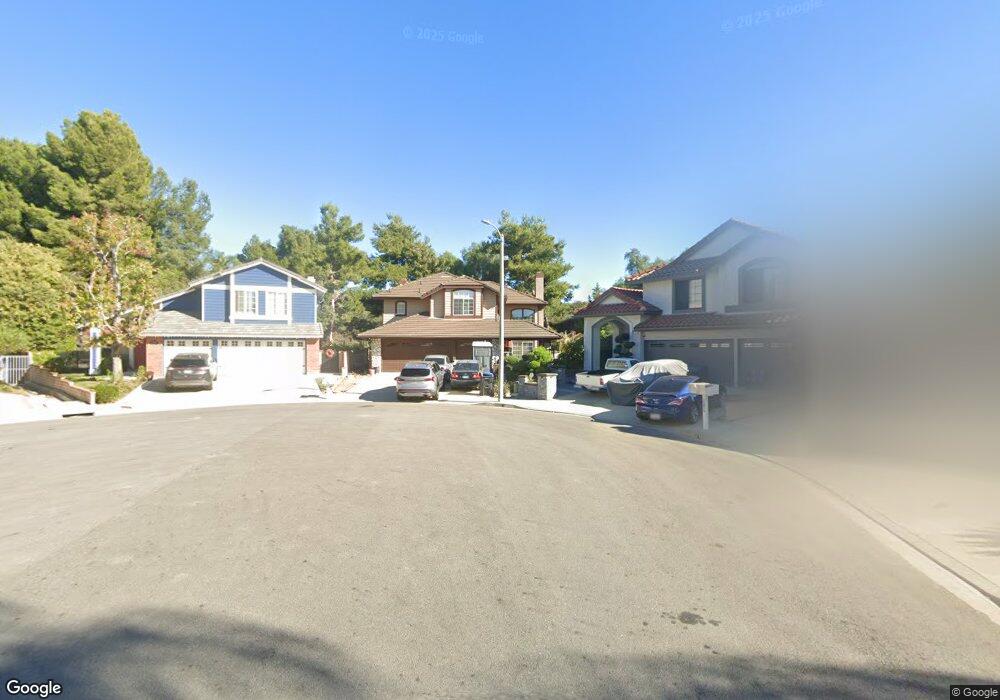
13909 Ravenwood Dr Chino Hills, CA 91709
North Chino Hills NeighborhoodEstimated Value: $396,871 - $1,401,000
4
Beds
3
Baths
2,511
Sq Ft
$330/Sq Ft
Est. Value
About This Home
This home is located at 13909 Ravenwood Dr, Chino Hills, CA 91709 and is currently estimated at $828,468, approximately $329 per square foot. 13909 Ravenwood Dr is a home located in San Bernardino County with nearby schools including Country Springs Elementary School, Canyon Hills Junior High School, and Ruben S. Ayala High School.
Ownership History
Date
Name
Owned For
Owner Type
Purchase Details
Closed on
Aug 21, 2025
Sold by
Rivera Glynn P
Bought by
Rivera Glynn P and Ranola Maricelle J
Current Estimated Value
Purchase Details
Closed on
Apr 15, 2025
Sold by
Ranola Maricelle J
Bought by
Rivera Glynn P
Home Financials for this Owner
Home Financials are based on the most recent Mortgage that was taken out on this home.
Original Mortgage
$302,500
Interest Rate
6.76%
Mortgage Type
New Conventional
Purchase Details
Closed on
Nov 6, 2001
Sold by
Rivera George S
Bought by
Rivera George S and Rivera Gloria C
Purchase Details
Closed on
Feb 25, 1994
Sold by
Seares Aida
Bought by
Rivera George and Rivera Gloria
Home Financials for this Owner
Home Financials are based on the most recent Mortgage that was taken out on this home.
Original Mortgage
$240,000
Interest Rate
7.38%
Create a Home Valuation Report for This Property
The Home Valuation Report is an in-depth analysis detailing your home's value as well as a comparison with similar homes in the area
Home Values in the Area
Average Home Value in this Area
Purchase History
| Date | Buyer | Sale Price | Title Company |
|---|---|---|---|
| Rivera Glynn P | -- | None Listed On Document | |
| Rivera Glynn P | -- | Usa National Title | |
| Rivera Glynn P | $400,000 | Usa National Title | |
| Rivera George S | -- | -- | |
| Rivera George S | -- | -- | |
| Rivera George | -- | Orange Coast Title |
Source: Public Records
Mortgage History
| Date | Status | Borrower | Loan Amount |
|---|---|---|---|
| Previous Owner | Rivera Glynn P | $302,500 | |
| Previous Owner | Rivera George | $240,000 |
Source: Public Records
Tax History Compared to Growth
Tax History
| Year | Tax Paid | Tax Assessment Tax Assessment Total Assessment is a certain percentage of the fair market value that is determined by local assessors to be the total taxable value of land and additions on the property. | Land | Improvement |
|---|---|---|---|---|
| 2025 | $5,229 | $442,344 | $125,630 | $316,714 |
| 2024 | $5,229 | $433,671 | $123,167 | $310,504 |
| 2023 | $5,097 | $425,168 | $120,752 | $304,416 |
| 2022 | $5,068 | $416,831 | $118,384 | $298,447 |
| 2021 | $4,978 | $408,658 | $116,063 | $292,595 |
| 2020 | $4,919 | $404,468 | $114,873 | $289,595 |
| 2019 | $4,841 | $396,538 | $112,621 | $283,917 |
| 2018 | $4,744 | $388,763 | $110,413 | $278,350 |
| 2017 | $4,667 | $381,140 | $108,248 | $272,892 |
| 2016 | $4,392 | $373,666 | $106,125 | $267,541 |
| 2015 | $4,313 | $368,053 | $104,531 | $263,522 |
| 2014 | $4,790 | $360,843 | $102,483 | $258,360 |
Source: Public Records
Map
Nearby Homes
- 13593 Monte Royale Dr
- 13952 Woodrose Ct
- 13663 Monteverde Dr
- 14171 Shoreline Dr
- 13530 Tawny Ln
- 13470 Palamos Place
- 14155 Applegate Ln
- 3056 Giant Forest Loop
- 2460 Windmill Creek Rd
- 2308 Wandering Ridge Dr
- 2286 Black Pine Rd
- 13255 Sonrisa Dr
- 13149 Pinnacle Ct
- 13151 Pinnacle Ct
- 2155 Camino Largo Dr
- 13133 Le Parc Unit 308
- 13194 Spire Cir
- 13163 Pinnacle Ct
- 14726 Moon Crest Ln Unit E
- 2515 Pointe Coupee
- 13913 Ravenwood Dr
- 13903 Ravenwood Dr
- 13919 Ravenwood Dr
- 13908 Ravenwood Dr
- 13914 Ravenwood Dr
- 13925 Ravenwood Dr
- 2466 Pheasant Run Dr
- 13920 Ravenwood Dr
- 2444 Pheasant Run Dr
- 2478 Pheasant Run Dr
- 0 Highridge Dr
- 13926 Ravenwood Dr
- 2512 Viewridge Dr
- 13932 Ravenwood Dr
- 13933 Falcon Ridge Dr
- 13939 Ravenwood Dr
- 13938 Ravenwood Dr
- 2521 Viewridge Dr
- 13941 Falcon Ridge Dr
- 13944 Ravenwood Dr