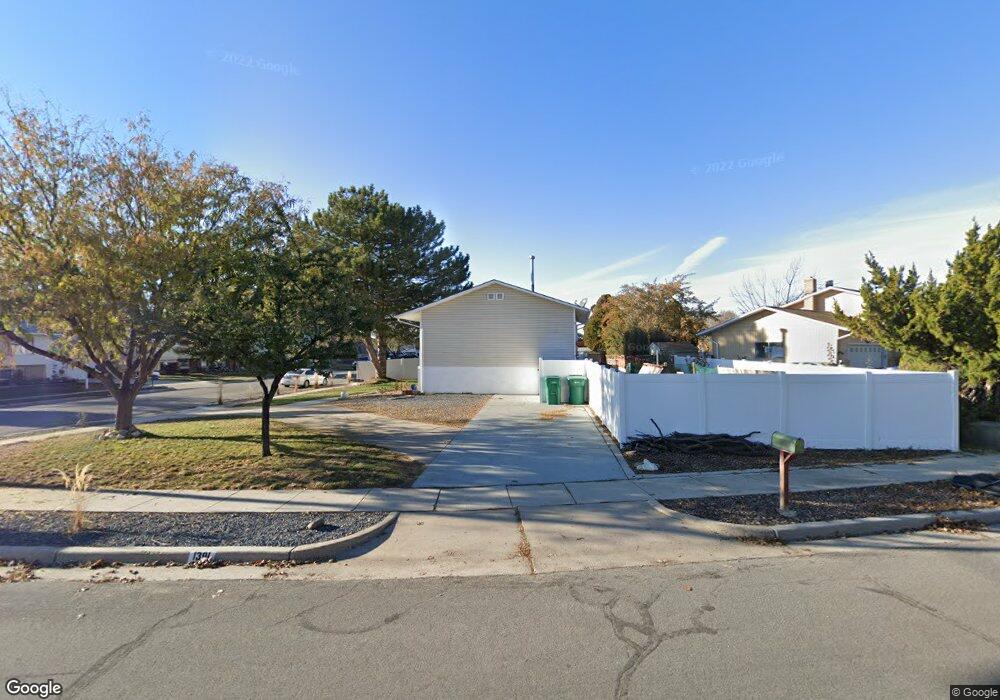
1391 N 1850 W Layton, UT 84041
Estimated Value: $391,000 - $428,000
5
Beds
2
Baths
1,746
Sq Ft
$236/Sq Ft
Est. Value
About This Home
This home is located at 1391 N 1850 W, Layton, UT 84041 and is currently estimated at $412,511, approximately $236 per square foot. 1391 N 1850 W is a home located in Davis County with nearby schools including Vae View Elementary School, Central Davis Junior High School, and Layton High School.
Ownership History
Date
Name
Owned For
Owner Type
Purchase Details
Closed on
Oct 23, 2020
Sold by
Hallam Andrew
Bought by
City Of Layton
Current Estimated Value
Home Financials for this Owner
Home Financials are based on the most recent Mortgage that was taken out on this home.
Original Mortgage
$270,750
Outstanding Balance
$240,818
Interest Rate
2.9%
Mortgage Type
New Conventional
Estimated Equity
$171,693
Purchase Details
Closed on
Nov 9, 2016
Sold by
Fasick Caden and Brackeen Laura
Bought by
Fasick Caden T and Fasick Laura Avis
Purchase Details
Closed on
Jun 28, 2001
Sold by
Apgood Jeffrey D and Apgood Greta M
Bought by
Nokes John H
Home Financials for this Owner
Home Financials are based on the most recent Mortgage that was taken out on this home.
Original Mortgage
$102,007
Interest Rate
7.14%
Mortgage Type
FHA
Create a Home Valuation Report for This Property
The Home Valuation Report is an in-depth analysis detailing your home's value as well as a comparison with similar homes in the area
Home Values in the Area
Average Home Value in this Area
Purchase History
| Date | Buyer | Sale Price | Title Company |
|---|---|---|---|
| City Of Layton | -- | Backman Title Services | |
| Hallam Andrew | -- | Title Guarantee | |
| Fasick Caden T | -- | Gateway Title | |
| Nokes John H | -- | Bonneville Title Company Inc |
Source: Public Records
Mortgage History
| Date | Status | Borrower | Loan Amount |
|---|---|---|---|
| Open | Hallam Andrew | $270,750 | |
| Closed | City Of Layton | $270,750 | |
| Previous Owner | Nokes John H | $102,007 |
Source: Public Records
Tax History Compared to Growth
Tax History
| Year | Tax Paid | Tax Assessment Tax Assessment Total Assessment is a certain percentage of the fair market value that is determined by local assessors to be the total taxable value of land and additions on the property. | Land | Improvement |
|---|---|---|---|---|
| 2025 | $1,839 | $193,050 | $97,133 | $95,917 |
| 2024 | $1,805 | $190,850 | $116,009 | $74,841 |
| 2023 | $1,749 | $326,000 | $152,153 | $173,847 |
| 2022 | $1,815 | $183,700 | $71,105 | $112,595 |
| 2021 | $1,656 | $250,000 | $100,809 | $149,191 |
| 2020 | $1,402 | $203,000 | $74,050 | $128,950 |
| 2019 | $1,410 | $200,000 | $71,204 | $128,796 |
| 2018 | $1,222 | $174,000 | $65,930 | $108,070 |
| 2016 | $1,077 | $79,145 | $19,021 | $60,124 |
| 2015 | $834 | $58,190 | $19,021 | $39,169 |
| 2014 | $966 | $68,861 | $19,021 | $49,840 |
| 2013 | -- | $69,703 | $20,680 | $49,023 |
Source: Public Records
Map
Nearby Homes
- 1451 N 1875 W Unit 168
- 1455 N 1875 W Unit 167
- 1459 N 1875 W
- 1459 N 1875 W Unit 166
- 1463 N 1875 W Unit 165
- 1463 N 1875 W
- 1476 N 1875 W Unit 164
- 1452 N 1875 W Unit 146
- 1479 N 1875 W
- 1479 N 1875 W Unit 161
- 1483 N 1875 W
- 1487 N 1875 W
- 1487 N 1875 W Unit 159
- 1491 N 1875 W
- 1491 N 1875 W Unit 158
- 1523 Sherma Ave
- 1219 N 1875 W
- 1219 N 1875 W Unit 212
- 1211 N 1875 W Unit 211
- 1211 N 1875 W
- 1421 N 1850 W
- 1418 N Celia Way
- 1443 N 1850 W
- 1401 N Celia Way
- 1397 N Celia Way
- 1384 N Celia Way
- 1392 N 1850 W
- 1426 N Celia Way
- 1413 N Celia Way
- 1414 N 1850 W
- 1389 N Celia Way
- 1451 N 1850 W
- 1424 N 1850 W
- 1421 N Celia Way
- 1432 N 1850 W
- 1381 N Celia Way
- 1374 N Celia Way
- 1762 W 1375 N
- 1444 N 1850 W
- 1457 N 1850 W