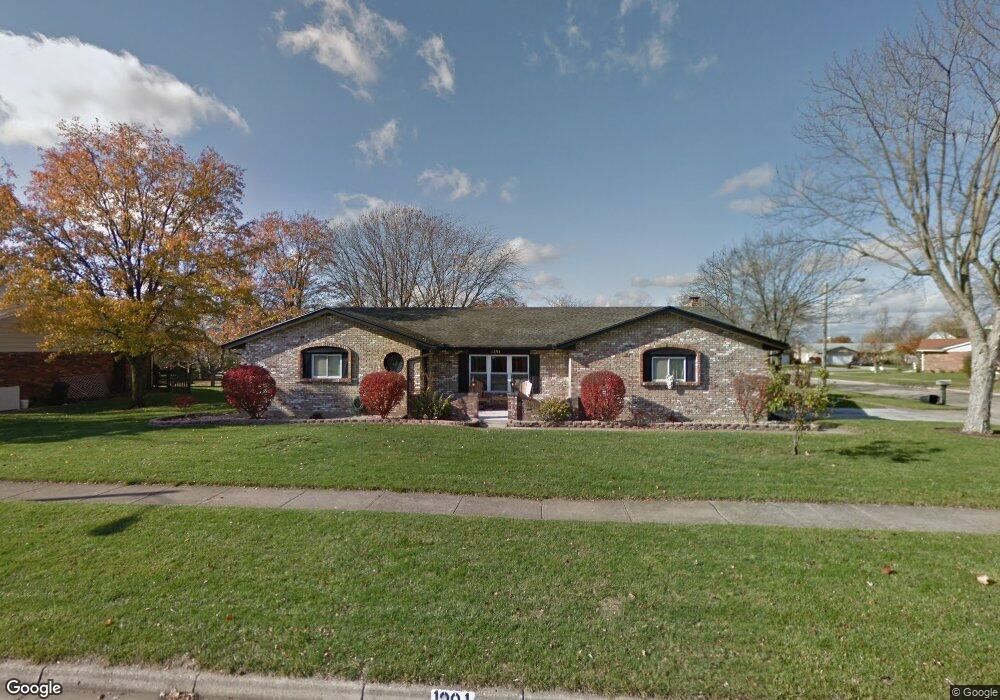
1391 Stoney Springs Rd Vandalia, OH 45377
Estimated Value: $271,965 - $291,000
3
Beds
2
Baths
2,012
Sq Ft
$142/Sq Ft
Est. Value
About This Home
This home is located at 1391 Stoney Springs Rd, Vandalia, OH 45377 and is currently estimated at $285,741, approximately $142 per square foot. 1391 Stoney Springs Rd is a home located in Montgomery County with nearby schools including Helke Elementary School, Morton Middle School, and Butler High School.
Ownership History
Date
Name
Owned For
Owner Type
Purchase Details
Closed on
Jul 17, 2020
Sold by
Mosley Latessa G
Bought by
Berhow David J
Current Estimated Value
Home Financials for this Owner
Home Financials are based on the most recent Mortgage that was taken out on this home.
Original Mortgage
$183,612
Outstanding Balance
$162,037
Interest Rate
3.2%
Mortgage Type
FHA
Estimated Equity
$123,704
Purchase Details
Closed on
Nov 14, 2012
Sold by
Brazie Lawrence D and Brazie Syivia M
Bought by
Mosley Latessa G
Home Financials for this Owner
Home Financials are based on the most recent Mortgage that was taken out on this home.
Original Mortgage
$90,000
Interest Rate
3.32%
Mortgage Type
Future Advance Clause Open End Mortgage
Purchase Details
Closed on
Sep 22, 2011
Sold by
Whitaker Margaret L
Bought by
Brazie Lawrence D and Brazie Rachel M
Create a Home Valuation Report for This Property
The Home Valuation Report is an in-depth analysis detailing your home's value as well as a comparison with similar homes in the area
Home Values in the Area
Average Home Value in this Area
Purchase History
| Date | Buyer | Sale Price | Title Company |
|---|---|---|---|
| Berhow David J | $187,000 | Pctitle Pros | |
| Mosley Latessa G | $112,500 | Home Services Title Llc | |
| Brazie Lawrence D | $105,000 | Attorney |
Source: Public Records
Mortgage History
| Date | Status | Borrower | Loan Amount |
|---|---|---|---|
| Open | Berhow David J | $183,612 | |
| Previous Owner | Mosley Latessa G | $90,000 |
Source: Public Records
Tax History
| Year | Tax Paid | Tax Assessment Tax Assessment Total Assessment is a certain percentage of the fair market value that is determined by local assessors to be the total taxable value of land and additions on the property. | Land | Improvement |
|---|---|---|---|---|
| 2025 | $3,265 | $60,560 | $16,410 | $44,150 |
| 2024 | $3,163 | $60,560 | $16,410 | $44,150 |
| 2023 | $3,163 | $60,560 | $16,410 | $44,150 |
| 2022 | $2,835 | $43,880 | $11,890 | $31,990 |
| 2021 | $2,838 | $43,880 | $11,890 | $31,990 |
| 2020 | $2,828 | $43,880 | $11,890 | $31,990 |
| 2019 | $2,680 | $38,090 | $13,080 | $25,010 |
| 2018 | $2,686 | $38,090 | $13,080 | $25,010 |
| 2017 | $2,665 | $38,090 | $13,080 | $25,010 |
| 2016 | $2,615 | $36,720 | $11,890 | $24,830 |
| 2015 | $2,582 | $36,720 | $11,890 | $24,830 |
| 2014 | $2,582 | $36,720 | $11,890 | $24,830 |
| 2012 | -- | $36,750 | $11,900 | $24,850 |
Source: Public Records
Map
Nearby Homes
- 1371 Cornish Dr
- 1054 Wilhelmina Dr
- 1025 Ronald St
- 1025 Helke Rd
- 1727 Ashworth Dr
- 8375 Peters Pike
- 246 Crest Hill Ave
- 905 Pool Ave
- 1182 Park Forest Dr
- 485 Pilot Point Unit 1-301
- Newcastle Plan at Yorkshire Reserve - The Oaks
- Bellamy Plan at Yorkshire Reserve - The Oaks
- Holcombe Plan at Yorkshire Reserve - The Oaks
- Chatham Plan at Yorkshire Reserve - The Oaks
- 3338 Turtle Shell Dr
- 76 Farrell Rd
- 7543 Abraham Ct
- 7531 Turtleback Dr
- 3185 Northerton Ct
- 3181 Northerton Ct
- 1423 Cornish Dr
- 1401 Stoney Springs Rd
- 1386 Stoney Springs Rd
- 1428 Cornish Dr
- 1417 Cornish Dr
- 1407 Stoney Springs Rd
- 1376 Stoney Springs Rd
- 1410 Cornish Dr
- 1406 Stoney Springs Rd
- 851 Norwich Rd
- 1369 Stoney Springs Rd
- 1370 Stoney Springs Rd
- 852 Norwich Rd
- 1409 Cornish Dr
- 1394 Cornish Dr
- 907 Stonequarry Rd
- 907 Stonequarry Rd
- 1395 Chelsea Ave
- 1361 Stoney Springs Rd
- 1381 Chelsea Ave
Your Personal Tour Guide
Ask me questions while you tour the home.