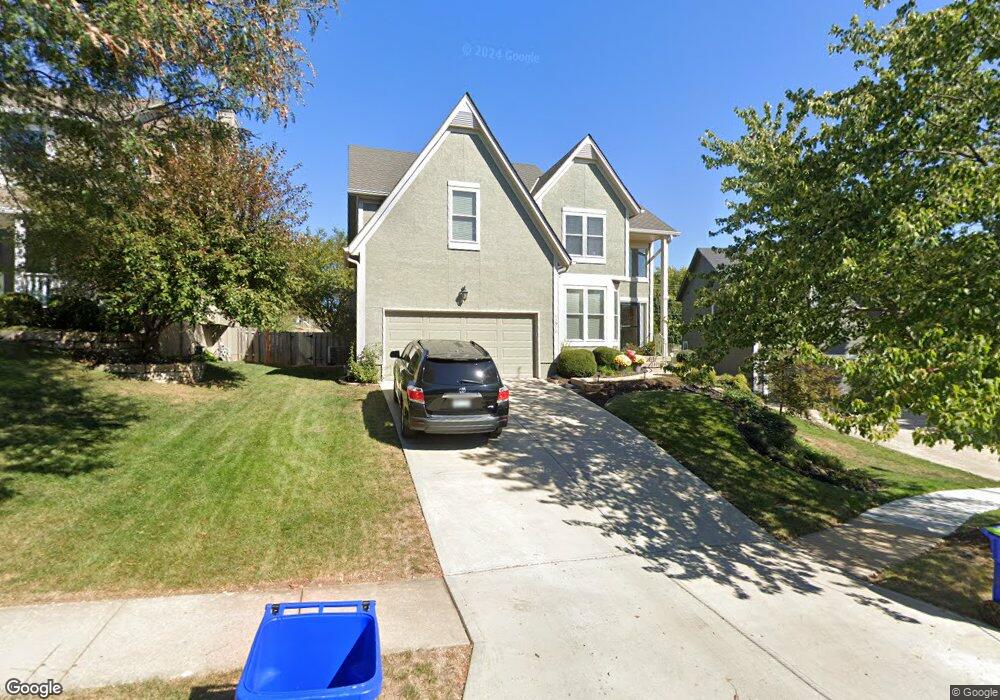
13910 W 71st Terrace Shawnee, KS 66216
Estimated Value: $485,672 - $516,000
4
Beds
3
Baths
2,369
Sq Ft
$211/Sq Ft
Est. Value
About This Home
This home is located at 13910 W 71st Terrace, Shawnee, KS 66216 and is currently estimated at $500,668, approximately $211 per square foot. 13910 W 71st Terrace is a home located in Johnson County with nearby schools including Christa McAuliffe Elementary School, Trailridge Middle School, and Shawnee Mission Northwest High School.
Ownership History
Date
Name
Owned For
Owner Type
Purchase Details
Closed on
Jul 9, 2021
Sold by
Zych Gary M and Zych Kellie
Bought by
Zych Gary M and Zych Kellie
Current Estimated Value
Home Financials for this Owner
Home Financials are based on the most recent Mortgage that was taken out on this home.
Original Mortgage
$174,420
Outstanding Balance
$106,579
Interest Rate
2.3%
Mortgage Type
New Conventional
Estimated Equity
$394,089
Purchase Details
Closed on
Jul 25, 2017
Sold by
Zych Gary M and Zych Kellie
Bought by
Zych Gary M and Zych Kellie
Home Financials for this Owner
Home Financials are based on the most recent Mortgage that was taken out on this home.
Original Mortgage
$209,200
Interest Rate
3.17%
Mortgage Type
New Conventional
Purchase Details
Closed on
Feb 25, 2016
Sold by
Zych Gary M and Zych Kellie
Bought by
Zych Gary M and Zych Kellie
Create a Home Valuation Report for This Property
The Home Valuation Report is an in-depth analysis detailing your home's value as well as a comparison with similar homes in the area
Home Values in the Area
Average Home Value in this Area
Purchase History
| Date | Buyer | Sale Price | Title Company |
|---|---|---|---|
| Zych Gary M | -- | Amrock Inc | |
| Zych Gary M | -- | Amrock Inc | |
| Zych Living Trust | -- | New Title Company Name | |
| Zych Gary M | -- | New Title Company Name | |
| Zych Gary M | -- | None Available | |
| Zych Gary M | -- | None Available | |
| Zych Gary M | -- | None Available |
Source: Public Records
Mortgage History
| Date | Status | Borrower | Loan Amount |
|---|---|---|---|
| Open | Zych Gary M | $174,420 | |
| Closed | Zych Gary M | $174,420 | |
| Previous Owner | Zych Gary M | $209,200 |
Source: Public Records
Tax History Compared to Growth
Tax History
| Year | Tax Paid | Tax Assessment Tax Assessment Total Assessment is a certain percentage of the fair market value that is determined by local assessors to be the total taxable value of land and additions on the property. | Land | Improvement |
|---|---|---|---|---|
| 2024 | $5,187 | $48,806 | $8,795 | $40,011 |
| 2023 | $5,026 | $46,828 | $7,996 | $38,832 |
| 2022 | $4,836 | $44,896 | $7,996 | $36,900 |
| 2021 | $4,836 | $36,214 | $7,268 | $28,946 |
| 2020 | $3,554 | $30,590 | $6,303 | $24,287 |
| 2019 | $3,586 | $30,854 | $5,730 | $25,124 |
| 2018 | $3,545 | $30,383 | $5,730 | $24,653 |
| 2017 | $3,584 | $30,245 | $5,253 | $24,992 |
| 2016 | $3,592 | $29,934 | $5,253 | $24,681 |
| 2015 | $3,312 | $28,600 | $5,253 | $23,347 |
| 2013 | -- | $25,921 | $5,253 | $20,668 |
Source: Public Records
Map
Nearby Homes
- 13903 W 71st Place
- 7029 Albervan St
- 13800 W 75th Ct
- 7325 Oakview St
- 13716 W 75th Terrace
- 13100 W 72nd St
- 7105 Richards Dr
- 7115 Richards Dr
- 6640 Pflumm Rd
- 7514 Caenen Lake Rd
- 13415 W 66th Terrace
- 13004 W 74th Terrace
- 6942 Constance St
- Augusta Plan at Kenneth Estates
- Newport Plan at Kenneth Estates
- Rosemount II Plan at Kenneth Estates
- The Avala Villa Plan at Kenneth Estates
- The Rosemount Villa Plan at Kenneth Estates
- Catalina II Plan at Kenneth Estates
- The Avala Plan at Kenneth Estates
- 13914 W 71st Terrace
- 13906 W 71st Terrace
- 13918 W 71st Terrace
- 13902 W 71st Terrace
- 13922 W 71st Terrace
- 13915 W 71st Terrace
- 13901 W 71st Terrace
- 13909 W 71st Terrace
- 13919 W 71st Terrace
- 7019 Widmer Rd
- 13905 W 71st Terrace
- 7020 Widmer Rd
- 13926 W 71st Terrace
- 13923 W 71st Terrace
- 7020 Rene St
- 7112 Park St
- 13927 W 71st Terrace
- 7015 Widmer Rd
- 7021 Cottonwood Dr