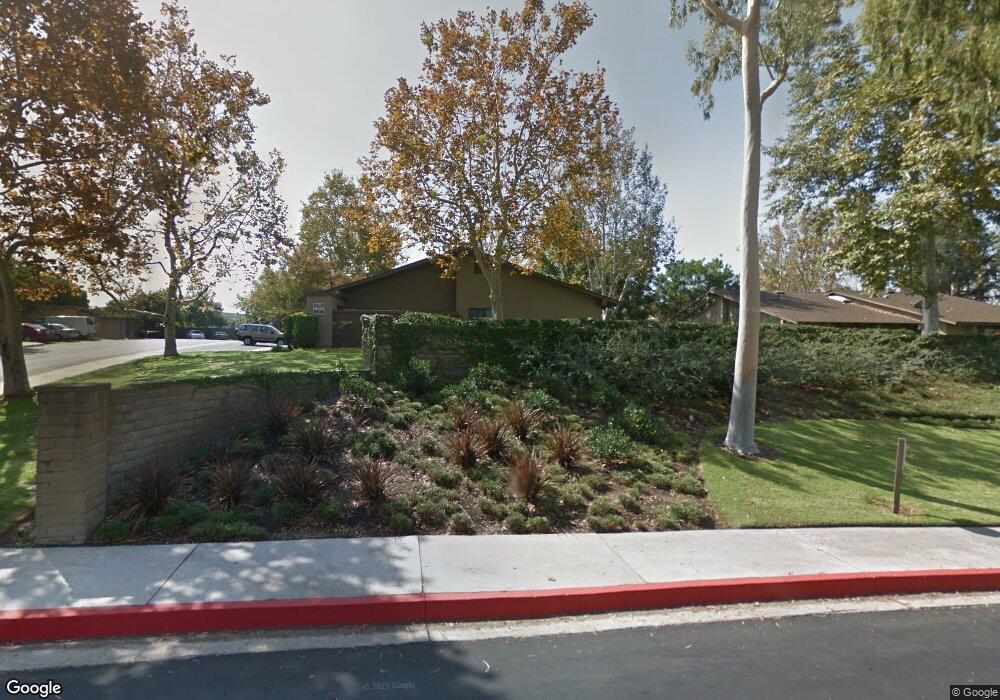
13913 Rio Hondo Cir Unit A La Mirada, CA 90638
Estimated Value: $648,794 - $732,000
3
Beds
2
Baths
1,305
Sq Ft
$534/Sq Ft
Est. Value
About This Home
This home is located at 13913 Rio Hondo Cir Unit A, La Mirada, CA 90638 and is currently estimated at $696,949, approximately $534 per square foot. 13913 Rio Hondo Cir Unit A is a home located in Los Angeles County with nearby schools including Eastwood Elementary School, Los Coyotes Middle School, and La Mirada High School.
Ownership History
Date
Name
Owned For
Owner Type
Purchase Details
Closed on
Jul 6, 2015
Sold by
Dela Rea Victoria A
Bought by
Dela Rea Victoria A and The Eurton & De La Rea Family
Current Estimated Value
Purchase Details
Closed on
Nov 18, 2010
Sold by
Eurton Carl Victor
Bought by
Dela Rea Victoria A
Home Financials for this Owner
Home Financials are based on the most recent Mortgage that was taken out on this home.
Original Mortgage
$280,000
Interest Rate
4.23%
Mortgage Type
New Conventional
Purchase Details
Closed on
Sep 23, 2010
Sold by
Edwards Alan L and The Dorothy M Edwards Revocabl
Bought by
Dela Rea Victoria A
Home Financials for this Owner
Home Financials are based on the most recent Mortgage that was taken out on this home.
Original Mortgage
$280,000
Interest Rate
4.23%
Mortgage Type
New Conventional
Purchase Details
Closed on
Nov 30, 2004
Sold by
Edwards Dorothy M
Bought by
Edwards Dorothy M and Dorothy M Edwards Revocable Tr
Create a Home Valuation Report for This Property
The Home Valuation Report is an in-depth analysis detailing your home's value as well as a comparison with similar homes in the area
Home Values in the Area
Average Home Value in this Area
Purchase History
| Date | Buyer | Sale Price | Title Company |
|---|---|---|---|
| Dela Rea Victoria A | -- | None Available | |
| Dela Rea Victoria A | -- | Fidelity National Title | |
| Dela Rea Victoria A | $350,000 | Fidelity National Title | |
| Edwards Dorothy M | -- | -- |
Source: Public Records
Mortgage History
| Date | Status | Borrower | Loan Amount |
|---|---|---|---|
| Previous Owner | Dela Rea Victoria A | $280,000 |
Source: Public Records
Tax History Compared to Growth
Tax History
| Year | Tax Paid | Tax Assessment Tax Assessment Total Assessment is a certain percentage of the fair market value that is determined by local assessors to be the total taxable value of land and additions on the property. | Land | Improvement |
|---|---|---|---|---|
| 2025 | $5,773 | $448,402 | $277,754 | $170,648 |
| 2024 | $5,773 | $439,610 | $272,308 | $167,302 |
| 2023 | $5,575 | $430,991 | $266,969 | $164,022 |
| 2022 | $5,478 | $422,541 | $261,735 | $160,806 |
| 2021 | $5,401 | $414,256 | $256,603 | $157,653 |
| 2020 | $5,267 | $410,009 | $253,972 | $156,037 |
| 2019 | $5,245 | $401,971 | $248,993 | $152,978 |
| 2018 | $5,076 | $394,090 | $244,111 | $149,979 |
| 2016 | $4,871 | $378,789 | $234,633 | $144,156 |
| 2015 | $4,831 | $373,100 | $231,109 | $141,991 |
| 2014 | $4,493 | $365,792 | $226,582 | $139,210 |
Source: Public Records
Map
Nearby Homes
- 15816 La Pena Ave
- 14006 Las Puertas St
- 13602 La Jolla Cir Unit B
- 13644 La Jolla Cir Unit 14B
- 13624 La Jolla Cir Unit F
- 14111 El Mirador St
- 13526 La Jolla Cir Unit 207-D
- 13515 Avenida Santa Tecla Unit 210D
- 13556 La Jolla Cir Unit 208H
- 15920 Alta Vista Dr Unit 2-C
- 15956 Alicante Rd
- 13115 Avenida Santa Tecla Unit 311-A
- 13212 La Jolla Cir Unit 307-B
- 14611 Dunnet Ave
- 15960 Glazebrook Dr
- 15856 Lawnhill Dr
- 16209 Eagleridge Ct
- 14724 Mercado Ave
- 13210 Avenida Socorro
- 12817 Meadow Green Rd
- 13915 Rio Hondo Cir Unit B--804
- 13915 Rio Hondo Cir Unit 804B
- 13913 Rio Hondo Cir Unit 802-C
- 13915 Rio Hondo Cir Unit A
- 13913 Rio Hondo Cir Unit C
- 13913 Rio Hondo Cir Unit B
- 13909 Rio Hondo Cir Unit 801A
- 13909 Rio Hondo Cir Unit 801C
- 13909 Rio Hondo Cir
- 13919 Rio Hondo Cir Unit 803-C
- 13909 Rio Hondo Cir Unit 801-E
- 13909 Rio Hondo Cir Unit 801B
- 13909 Rio Hondo Cir Unit A
- 13919 Rio Hondo Cir Unit C
- 13919 Rio Hondo Cir Unit B
- 13919 Rio Hondo Cir Unit A
- 13909 Rio Hondo Cir Unit E
- 13909 Rio Hondo Cir Unit 801D
- 13909 Rio Hondo Cir Unit C
- 15817 La Pena Ave