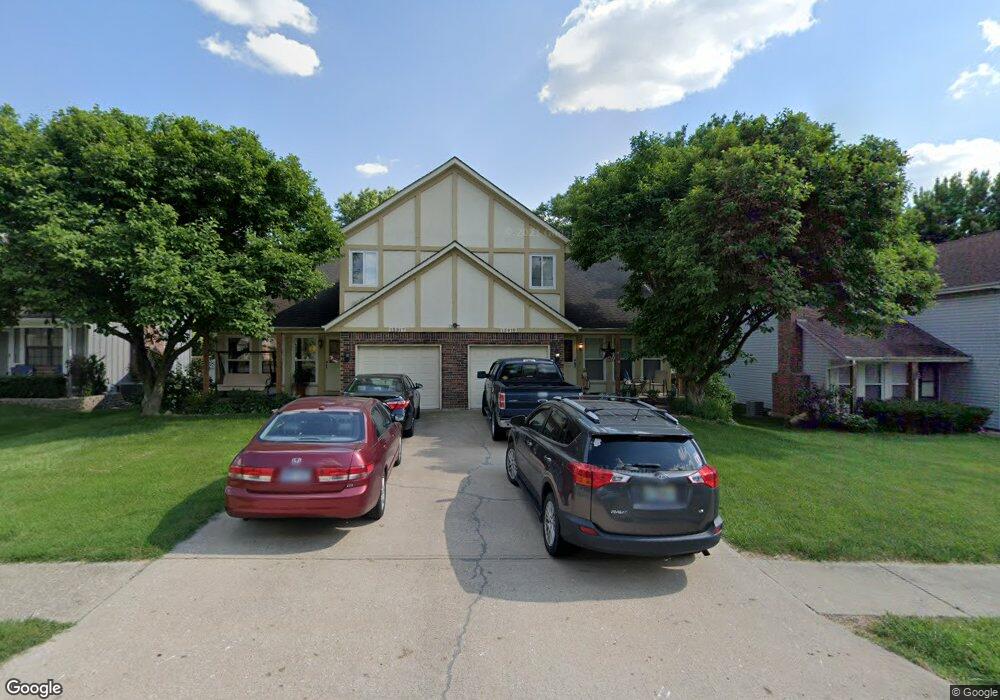
13917 W 88th Terrace Lenexa, KS 66215
Estimated Value: $325,000 - $506,000
6
Beds
6
Baths
2,544
Sq Ft
$164/Sq Ft
Est. Value
About This Home
This home is located at 13917 W 88th Terrace, Lenexa, KS 66215 and is currently estimated at $416,731, approximately $163 per square foot. 13917 W 88th Terrace is a home located in Johnson County with nearby schools including Rising Star Elementary School, Westridge Middle School, and Shawnee Mission West High School.
Ownership History
Date
Name
Owned For
Owner Type
Purchase Details
Closed on
Nov 15, 2012
Sold by
Slinkard David E and Slinkard Jan E
Bought by
Slinkard David E and Slinkard Jan M
Current Estimated Value
Home Financials for this Owner
Home Financials are based on the most recent Mortgage that was taken out on this home.
Original Mortgage
$150,000
Outstanding Balance
$24,647
Interest Rate
2.71%
Mortgage Type
New Conventional
Estimated Equity
$392,084
Purchase Details
Closed on
May 27, 2004
Sold by
S & B Co D Llc
Bought by
Slinkard David E and Slinkard Jan E
Home Financials for this Owner
Home Financials are based on the most recent Mortgage that was taken out on this home.
Original Mortgage
$221,400
Interest Rate
5.97%
Mortgage Type
Seller Take Back
Purchase Details
Closed on
Dec 5, 2002
Sold by
S & B Co D Inc
Bought by
S & B Co D Llc
Purchase Details
Closed on
Jan 4, 2002
Sold by
Plumer H Stephen and Plumer Betty R
Bought by
S & B Company D Inc
Create a Home Valuation Report for This Property
The Home Valuation Report is an in-depth analysis detailing your home's value as well as a comparison with similar homes in the area
Home Values in the Area
Average Home Value in this Area
Purchase History
| Date | Buyer | Sale Price | Title Company |
|---|---|---|---|
| Slinkard David E | -- | None Available | |
| Slinkard David E | -- | Ati Title Co | |
| S & B Co D Llc | -- | -- | |
| S & B Company D Inc | -- | -- |
Source: Public Records
Mortgage History
| Date | Status | Borrower | Loan Amount |
|---|---|---|---|
| Open | Slinkard David E | $150,000 | |
| Closed | Slinkard David E | $221,400 |
Source: Public Records
Tax History Compared to Growth
Tax History
| Year | Tax Paid | Tax Assessment Tax Assessment Total Assessment is a certain percentage of the fair market value that is determined by local assessors to be the total taxable value of land and additions on the property. | Land | Improvement |
|---|---|---|---|---|
| 2024 | $4,063 | $35,857 | $5,722 | $30,135 |
| 2023 | $3,955 | $34,144 | $5,198 | $28,946 |
| 2022 | $3,603 | $30,981 | $4,724 | $26,257 |
| 2021 | $3,603 | $31,268 | $4,494 | $26,774 |
| 2020 | $3,655 | $29,498 | $4,085 | $25,413 |
| 2019 | $3,497 | $28,152 | $3,405 | $24,747 |
| 2018 | $3,350 | $26,680 | $3,405 | $23,275 |
| 2017 | $3,157 | $24,299 | $3,099 | $21,200 |
| 2016 | $3,046 | $23,115 | $3,099 | $20,016 |
| 2015 | $3,017 | $23,046 | $3,099 | $19,947 |
| 2013 | -- | $20,217 | $3,099 | $17,118 |
Source: Public Records
Map
Nearby Homes
- 14101 W 88th Place
- 8815 Cottonwood St
- 8641 Greenwood Ln
- 9029 Acuff Ln
- 8528 Candlelight Ln
- 8919 Greenway Ln
- 13312 W 91st St
- 14424 W 84th Terrace
- 9202 Greenway Ln
- 13017 W 92nd St
- 8946 Country Hill Ct
- 9131 Darnell St
- 13212 W 84th St
- 9318 Greenway Ln
- 12894 W 93rd St
- 14915 W 84th Terrace
- 14828 W 83rd Place
- 8403 Swarner Dr
- 8545 Westgate St
- 15320 W 92nd Place
- 13913 W 88th Terrace
- 13923 W 88th Terrace
- 13911 W 88th Terrace
- 13929 W 88th Terrace
- 13914 W 89th St
- 8838 Cottonwood St
- 13920 W 89th St
- 13902 W 89th St
- 8839 Cottonwood St
- 8836 Cottonwood St
- 14009 W 88th Terrace
- 8865 Carriage Dr
- 8863 Carriage Dr
- 8837 Cottonwood St
- 14000 W 89th St
- 14011 W 88th Terrace
- 8830 Cottonwood St
- 8859 Carriage Dr
- 8833 Cottonwood St
- 8855 Carriage Dr