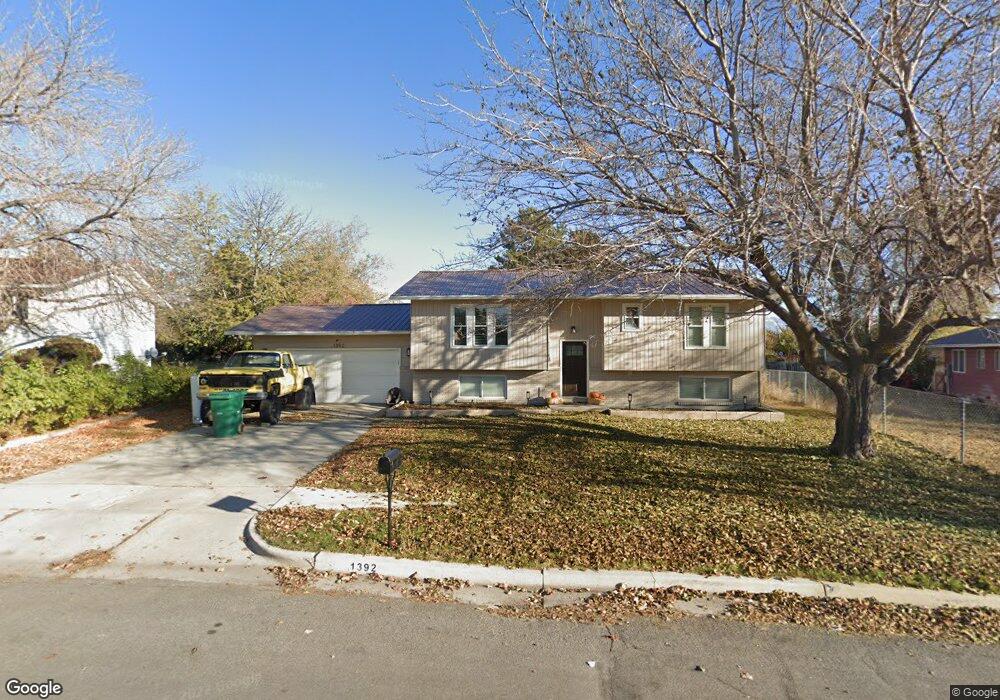
1392 N 1850 W Layton, UT 84041
Estimated Value: $435,000 - $484,000
4
Beds
2
Baths
2,046
Sq Ft
$221/Sq Ft
Est. Value
About This Home
This home is located at 1392 N 1850 W, Layton, UT 84041 and is currently estimated at $453,160, approximately $221 per square foot. 1392 N 1850 W is a home located in Davis County with nearby schools including Vae View Elementary School, Central Davis Junior High School, and Layton High School.
Ownership History
Date
Name
Owned For
Owner Type
Purchase Details
Closed on
Nov 1, 2021
Sold by
Catamount Properties 2018 Llc
Bought by
Blood Kevin Clint and Holfeltz Sydnie
Current Estimated Value
Home Financials for this Owner
Home Financials are based on the most recent Mortgage that was taken out on this home.
Original Mortgage
$340,000
Outstanding Balance
$310,048
Interest Rate
2.8%
Mortgage Type
New Conventional
Estimated Equity
$143,112
Purchase Details
Closed on
Jun 17, 2021
Sold by
Blackwater Investments Llc
Bought by
Catamount Properties 2018 Llc
Purchase Details
Closed on
May 13, 2021
Sold by
Tyer Christine and Estate Of Allie B Stephenson
Bought by
Blackwater Investments Llc
Purchase Details
Closed on
May 12, 2021
Sold by
Sumner Annette and Tyer Christine
Bought by
Blackwater Investments Llc
Purchase Details
Closed on
Feb 26, 2020
Sold by
Tyer Christine and Estate Of Mary Stephenson
Bought by
Sumner Annette and Tyer Christine
Create a Home Valuation Report for This Property
The Home Valuation Report is an in-depth analysis detailing your home's value as well as a comparison with similar homes in the area
Home Values in the Area
Average Home Value in this Area
Purchase History
| Date | Buyer | Sale Price | Title Company |
|---|---|---|---|
| Blood Kevin Clint | -- | Security Title Ins Age | |
| Catamount Properties 2018 Llc | -- | Rudd & Hawkes Ttl Ins Agcy L | |
| Blackwater Investments Llc | -- | Rudd & Hawkes Ttl Ins Agcy L | |
| Blackwater Investments Llc | -- | Rudd & Hawkes Ttl Ins Agcy L | |
| Sumner Annette | -- | None Available |
Source: Public Records
Mortgage History
| Date | Status | Borrower | Loan Amount |
|---|---|---|---|
| Open | Blood Kevin Clint | $340,000 |
Source: Public Records
Tax History Compared to Growth
Tax History
| Year | Tax Paid | Tax Assessment Tax Assessment Total Assessment is a certain percentage of the fair market value that is determined by local assessors to be the total taxable value of land and additions on the property. | Land | Improvement |
|---|---|---|---|---|
| 2025 | $2,159 | $226,600 | $104,249 | $122,351 |
| 2024 | $2,112 | $223,300 | $124,463 | $98,837 |
| 2023 | $2,033 | $379,000 | $161,893 | $217,107 |
| 2022 | $2,195 | $222,200 | $75,978 | $146,222 |
| 2021 | $1,762 | $274,000 | $108,178 | $165,822 |
| 2020 | $1,547 | $224,000 | $79,711 | $144,289 |
| 2019 | $1,537 | $218,000 | $76,647 | $141,353 |
| 2018 | $1,348 | $192,000 | $70,970 | $121,030 |
| 2016 | $1,183 | $86,900 | $20,359 | $66,541 |
| 2015 | $1,125 | $78,430 | $20,359 | $58,071 |
| 2014 | $1,122 | $79,977 | $20,359 | $59,618 |
| 2013 | -- | $81,415 | $20,680 | $60,735 |
Source: Public Records
Map
Nearby Homes
- 1523 Sherma Ave
- 1451 N 1875 W Unit 168
- 1455 N 1875 W Unit 167
- 1459 N 1875 W
- 1459 N 1875 W Unit 166
- 1476 N 1875 W Unit 164
- 1463 N 1875 W Unit 165
- 1463 N 1875 W
- 1452 N 1875 W Unit 146
- 1493 Marilyn Dr
- 1479 N 1875 W
- 1479 N 1875 W Unit 161
- 1483 N 1875 W
- 1591 N Marilyn Dr
- 1487 N 1875 W
- 1487 N 1875 W Unit 159
- 1491 N 1875 W
- 1491 N 1875 W Unit 158
- 1219 N 1875 W
- 1219 N 1875 W Unit 212
- 1414 N 1850 W
- 1384 N Celia Way
- 1762 W 1375 N
- 1374 N Celia Way
- 1424 N 1850 W
- 1429 N 1725 W
- 1744 W 1375 N
- 1421 N 1725 W
- 1391 N 1850 W
- 1421 N 1850 W
- 1432 N 1850 W
- 1389 N Celia Way
- 1381 N Celia Way
- 1437 N 1725 W
- 1443 N 1850 W
- 1397 N Celia Way
- 1418 N Celia Way
- 1415 N 1725 W
- 1379 N Celia Way
- 1401 N Celia Way