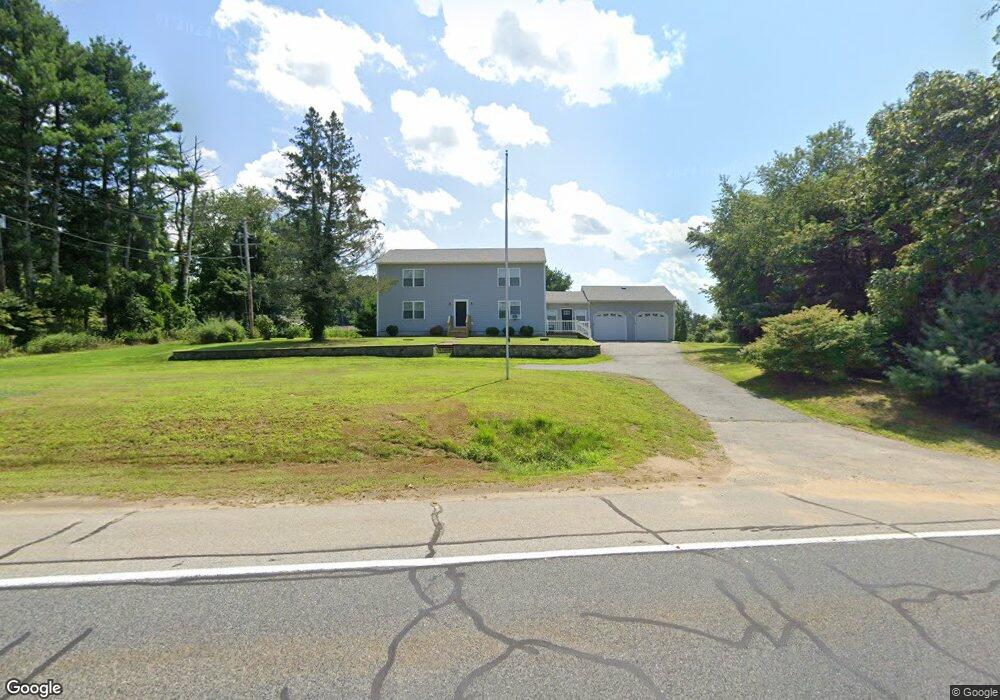
1392 Snake Hill Rd North Scituate, RI 02857
Estimated Value: $424,000 - $603,000
3
Beds
1
Bath
1,260
Sq Ft
$412/Sq Ft
Est. Value
About This Home
This home is located at 1392 Snake Hill Rd, North Scituate, RI 02857 and is currently estimated at $518,665, approximately $411 per square foot. 1392 Snake Hill Rd is a home located in Providence County with nearby schools including West Glocester Elementary School, Ponaganset Middle School, and Ponaganset High School.
Ownership History
Date
Name
Owned For
Owner Type
Purchase Details
Closed on
Mar 19, 2021
Sold by
Petrarca John A and Petrarca Christy L
Bought by
Petrarca John A and Petrarca Christy L
Current Estimated Value
Home Financials for this Owner
Home Financials are based on the most recent Mortgage that was taken out on this home.
Original Mortgage
$169,000
Outstanding Balance
$145,721
Interest Rate
2.8%
Mortgage Type
New Conventional
Estimated Equity
$372,944
Purchase Details
Closed on
Dec 13, 2017
Sold by
Peteson John A Est and Mcgunable
Bought by
Trainor Brian R
Purchase Details
Closed on
Dec 10, 2014
Sold by
Marnoch Claire D
Bought by
Petraca John A and Lynch Christy L
Home Financials for this Owner
Home Financials are based on the most recent Mortgage that was taken out on this home.
Original Mortgage
$183,673
Interest Rate
3.98%
Create a Home Valuation Report for This Property
The Home Valuation Report is an in-depth analysis detailing your home's value as well as a comparison with similar homes in the area
Home Values in the Area
Average Home Value in this Area
Purchase History
| Date | Buyer | Sale Price | Title Company |
|---|---|---|---|
| Petrarca John A | -- | None Available | |
| Trainor Brian R | $2,500 | -- | |
| Petraca John A | $180,000 | -- | |
| Petraca John A | $180,000 | -- |
Source: Public Records
Mortgage History
| Date | Status | Borrower | Loan Amount |
|---|---|---|---|
| Open | Petrarca John A | $169,000 | |
| Previous Owner | Petraca John A | $183,673 | |
| Previous Owner | Petraca John A | $22,000 |
Source: Public Records
Tax History Compared to Growth
Tax History
| Year | Tax Paid | Tax Assessment Tax Assessment Total Assessment is a certain percentage of the fair market value that is determined by local assessors to be the total taxable value of land and additions on the property. | Land | Improvement |
|---|---|---|---|---|
| 2025 | $6,483 | $454,600 | $114,300 | $340,300 |
| 2024 | $4,513 | $325,600 | $114,300 | $211,300 |
| 2023 | $4,640 | $325,600 | $114,300 | $211,300 |
| 2022 | $3,976 | $215,600 | $78,300 | $137,300 |
| 2021 | $3,976 | $215,600 | $78,300 | $137,300 |
| 2020 | $3,928 | $215,600 | $78,300 | $137,300 |
| 2018 | $3,820 | $191,000 | $69,600 | $121,400 |
| 2017 | $3,768 | $191,000 | $69,600 | $121,400 |
| 2016 | $4,113 | $183,200 | $64,800 | $118,400 |
| 2015 | $4,052 | $183,200 | $64,800 | $118,400 |
| 2014 | $3,988 | $183,200 | $64,800 | $118,400 |
| 2013 | $3,604 | $169,700 | $73,500 | $96,200 |
Source: Public Records
Map
Nearby Homes
- 1289 Snake Hill Rd
- 0 Stone Dam Rd
- 85 Indian Trail
- 302 Chopmist Hill Rd
- 728 Chestnut Hill Rd
- 165 Bungy Rd
- 109 Saunders Brook Rd
- 35 Wintergreen Way
- 17 Wintergreen Way
- 15 Apple Hill Dr
- 0 Huntinghouse Rd
- 367 Chestnut Hill Rd
- 955 Chopmist Hill Rd
- 175 Huntinghouse Rd
- 1224 Hartford Pike
- 1240 Hartford Pike
- 112 Cranberry Ridge Rd
- 47 Hartford Pike
- 140 Joe Sweet Rd
- 61 Diamond Hill Rd
- 1384 Snake Hill Rd
- 100 Rustic Hill Rd
- 1380 Snake Hill Rd
- 1414 Snake Hill Rd
- 1437 Snake Hill Rd
- 1366 Snake Hill Rd
- 1435 Snake Hill Rd
- 0 Cherry Valley Rd
- 1354 Snake Hill Rd
- 1430 Snake Hill Rd
- 1392 Snake Hill Rd
- 1346 Snake Hill Rd
- 15 Cherry Valley Rd
- 1440 Snake Hill Rd
- 1338 Snake Hill Rd
- 1339 Snake Hill Rd
- 1441 Snake Hill Rd
- 28 Cherry Valley Rd
- 32 Cherry Valley Rd
- 34 Cherry Valley Rd