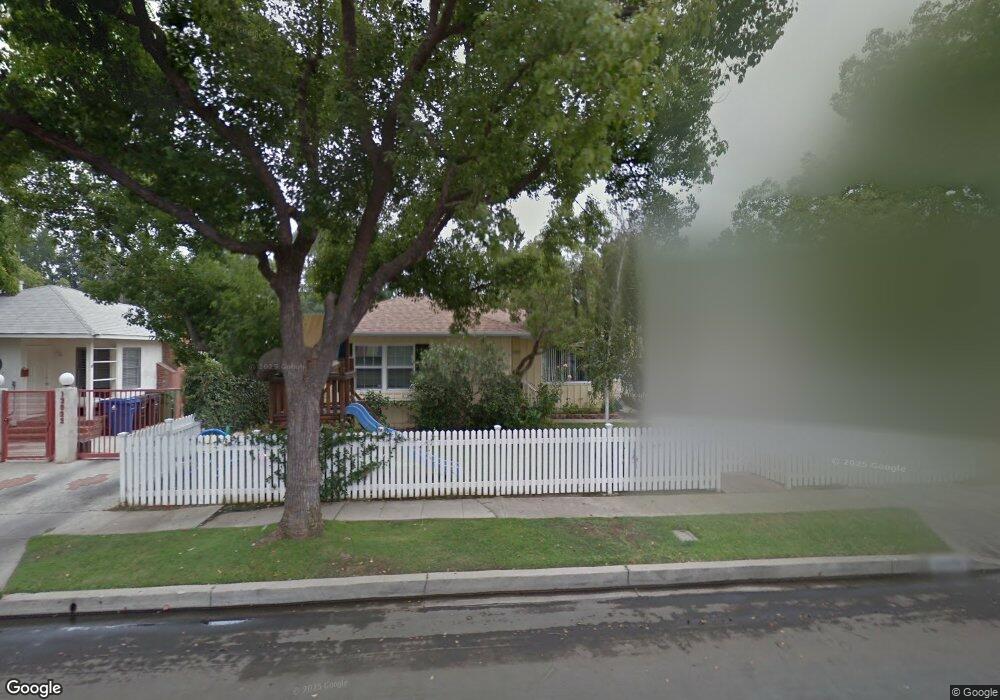
13928 Peach Grove St Sherman Oaks, CA 91423
Estimated Value: $1,452,000 - $1,597,000
4
Beds
1
Bath
1,544
Sq Ft
$1,001/Sq Ft
Est. Value
About This Home
This home is located at 13928 Peach Grove St, Sherman Oaks, CA 91423 and is currently estimated at $1,545,671, approximately $1,001 per square foot. 13928 Peach Grove St is a home located in Los Angeles County with nearby schools including Chandler Elementary, Ulysses S. Grant Senior High School, and Riverside Drive Charter Elementary School.
Ownership History
Date
Name
Owned For
Owner Type
Purchase Details
Closed on
Jun 18, 2003
Sold by
Feinstein Stuart
Bought by
Hronsky Yuri M and Hronsky Sarah R
Current Estimated Value
Home Financials for this Owner
Home Financials are based on the most recent Mortgage that was taken out on this home.
Original Mortgage
$436,000
Outstanding Balance
$175,089
Interest Rate
4.75%
Mortgage Type
New Conventional
Estimated Equity
$1,370,582
Purchase Details
Closed on
Nov 14, 1997
Sold by
Livingston Edward H
Bought by
Feinstein Stuart and Feinstein Elizabeth Anderson
Home Financials for this Owner
Home Financials are based on the most recent Mortgage that was taken out on this home.
Original Mortgage
$196,400
Interest Rate
7.19%
Create a Home Valuation Report for This Property
The Home Valuation Report is an in-depth analysis detailing your home's value as well as a comparison with similar homes in the area
Home Values in the Area
Average Home Value in this Area
Purchase History
| Date | Buyer | Sale Price | Title Company |
|---|---|---|---|
| Hronsky Yuri M | $545,000 | California Title Company | |
| Feinstein Stuart | $253,000 | First American Title |
Source: Public Records
Mortgage History
| Date | Status | Borrower | Loan Amount |
|---|---|---|---|
| Open | Hronsky Yuri M | $436,000 | |
| Previous Owner | Feinstein Stuart | $196,400 | |
| Closed | Hronsky Yuri M | $54,500 |
Source: Public Records
Tax History Compared to Growth
Tax History
| Year | Tax Paid | Tax Assessment Tax Assessment Total Assessment is a certain percentage of the fair market value that is determined by local assessors to be the total taxable value of land and additions on the property. | Land | Improvement |
|---|---|---|---|---|
| 2025 | $9,461 | $774,859 | $498,474 | $276,385 |
| 2024 | $9,339 | $759,666 | $488,700 | $270,966 |
| 2023 | $9,158 | $744,771 | $479,118 | $265,653 |
| 2022 | $8,731 | $730,169 | $469,724 | $260,445 |
| 2021 | $8,620 | $715,853 | $460,514 | $255,339 |
| 2020 | $8,705 | $708,513 | $455,792 | $252,721 |
| 2019 | $8,361 | $694,621 | $446,855 | $247,766 |
| 2018 | $8,244 | $681,002 | $438,094 | $242,908 |
| 2016 | $7,871 | $654,560 | $421,083 | $233,477 |
| 2015 | $7,755 | $644,728 | $414,758 | $229,970 |
| 2014 | $7,783 | $632,100 | $406,634 | $225,466 |
Source: Public Records
Map
Nearby Homes
- 13935 Huston St
- 14000 Morrison St
- 5003 Mammoth Ave
- 4824 Calhoun Ave
- 13905 Milbank St
- 13925 Branton Place
- 4846 Katherine Ave
- 4487 Colbath Ave Unit 310
- 4487 Colbath Ave Unit 207
- 4487 Colbath Ave Unit 101
- 14050 Magnolia Blvd Unit 316
- 4710 Ventura Canyon Ave
- 14011 Magnolia Blvd
- 4532 Calhoun Ave
- 4477 Woodman Ave Unit 304
- 4616 Ventura Canyon Ave
- 4500 Calhoun Ave
- 14315 Riverside Dr Unit 105
- 4526 Katherine Ave
- 4915 Tyrone Ave Unit 102
- 13934 Peach Grove St
- 13922 Peach Grove St
- 13929 La Maida St
- 13935 La Maida St
- 13923 La Maida St
- 13916 Peach Grove St
- 13940 Peach Grove St
- 13929 Peach Grove St
- 13941 La Maida St
- 13917 La Maida St
- 13923 Peach Grove St
- 13935 Peach Grove St
- 13910 Peach Grove St
- 13946 Peach Grove St
- 13917 Peach Grove St
- 13941 Peach Grove St
- 13947 La Maida St
- 13909 La Maida St
- 13909 Peach Grove St
- 13947 Peach Grove St