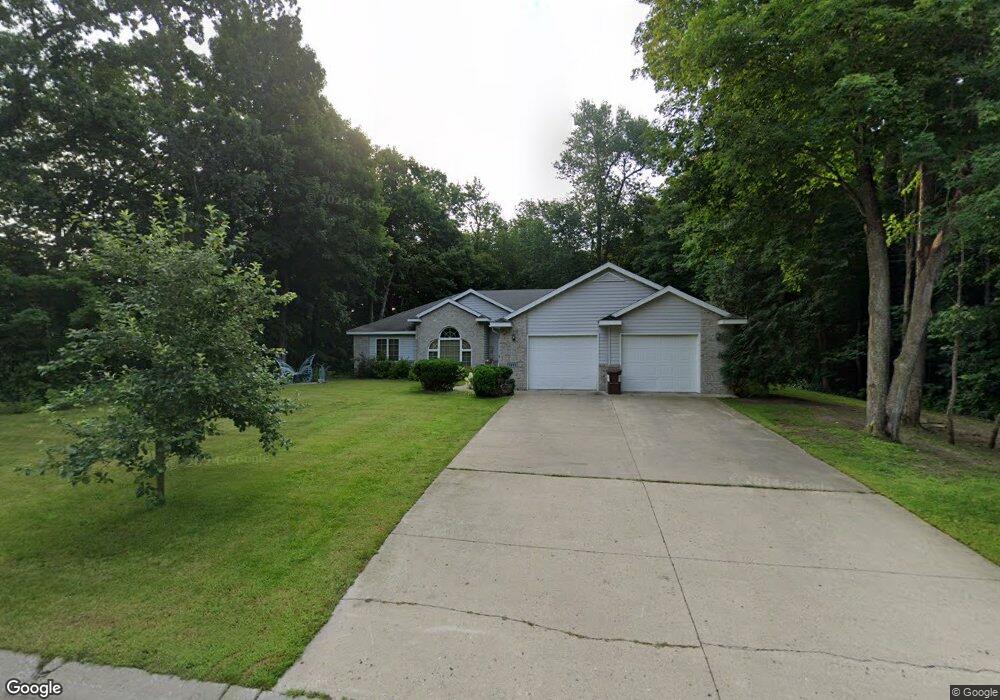
1393 Burroughs Rd Detroit Lakes, MN 56501
Estimated Value: $367,000 - $517,000
3
Beds
2
Baths
1,977
Sq Ft
$224/Sq Ft
Est. Value
About This Home
This home is located at 1393 Burroughs Rd, Detroit Lakes, MN 56501 and is currently estimated at $443,064, approximately $224 per square foot. 1393 Burroughs Rd is a home located in Becker County with nearby schools including Detroit Lakes Senior High School.
Ownership History
Date
Name
Owned For
Owner Type
Purchase Details
Closed on
May 14, 2021
Sold by
Gary W Ware Rt
Bought by
Ware Cody
Current Estimated Value
Purchase Details
Closed on
Nov 17, 2020
Sold by
Ware Gary W
Bought by
Gary W Ware Rt
Purchase Details
Closed on
May 23, 2016
Sold by
Ware Gary and Ware Barbara A
Bought by
Ware Gary
Purchase Details
Closed on
Jan 20, 2010
Sold by
Nelson James N and Nelson Heather K Ware
Bought by
Ware Gary and Ware Barbara
Home Financials for this Owner
Home Financials are based on the most recent Mortgage that was taken out on this home.
Original Mortgage
$186,400
Interest Rate
5%
Mortgage Type
New Conventional
Purchase Details
Closed on
Nov 26, 2008
Sold by
Whelihan Ellen M
Bought by
Nelson James N and Nelson Heather K Ware
Home Financials for this Owner
Home Financials are based on the most recent Mortgage that was taken out on this home.
Original Mortgage
$233,580
Interest Rate
6.04%
Mortgage Type
New Conventional
Create a Home Valuation Report for This Property
The Home Valuation Report is an in-depth analysis detailing your home's value as well as a comparison with similar homes in the area
Home Values in the Area
Average Home Value in this Area
Purchase History
| Date | Buyer | Sale Price | Title Company |
|---|---|---|---|
| Ware Cody | $300,000 | None Available | |
| Gary W Ware Rt | $3,000 | None Available | |
| Ware Gary | -- | None Available | |
| Ware Gary | $233,000 | All American Title Co | |
| Nelson James N | $229,000 | All American Title Co Inc |
Source: Public Records
Mortgage History
| Date | Status | Borrower | Loan Amount |
|---|---|---|---|
| Previous Owner | Ware Gary | $186,400 | |
| Previous Owner | Nelson James N | $233,580 |
Source: Public Records
Tax History Compared to Growth
Tax History
| Year | Tax Paid | Tax Assessment Tax Assessment Total Assessment is a certain percentage of the fair market value that is determined by local assessors to be the total taxable value of land and additions on the property. | Land | Improvement |
|---|---|---|---|---|
| 2025 | $3,250 | $352,400 | $43,900 | $308,500 |
| 2024 | $3,468 | $362,700 | $43,900 | $318,800 |
| 2023 | $3,468 | $338,300 | $38,000 | $300,300 |
| 2022 | $3,010 | $274,900 | $35,800 | $239,100 |
| 2021 | $3,094 | $270,300 | $35,800 | $234,500 |
| 2020 | $3,000 | $270,300 | $35,800 | $234,500 |
| 2019 | $2,954 | $259,900 | $35,800 | $224,100 |
| 2018 | $2,946 | $246,200 | $35,800 | $210,400 |
| 2017 | $2,658 | $246,100 | $34,100 | $212,000 |
| 2016 | $3,002 | $205,000 | $34,100 | $170,900 |
| 2015 | $2,828 | $223,300 | $33,400 | $189,900 |
| 2014 | -- | $216,000 | $33,400 | $182,600 |
Source: Public Records
Map
Nearby Homes
- 29280 Mchugh Rd
- 29284 Mchugh Rd
- 1158 S Shore Dr
- 1885 Aspen Dr
- 886 S Shore Dr
- 30289 Shady Ln
- Lot 11 Block 1 Ridge Rd
- Lot 1 Block 1 Ridge Rd
- Lot 7 Block 2 Ridge Rd
- Lot 1 Block 2 Ridge Rd
- Lot 8 Block 1 Ridge Rd
- 14750 Matson Rd
- 798 S Shore Dr
- 1077 S Shore Dr
- 109 Altavista Dr
- 119 Altavista Dr
- 15606 Meadow Rd
- 111 Altavista Dr
- 118 Altavista Dr
- 117 Altavista Dr
- 1383 Burroughs Rd
- 1913 E Shore Dr
- 1384 Burroughs Rd
- 1373 Burroughs Rd
- 2004 290 Ave
- 1374 Burroughs Rd
- 1907 E Shore Dr
- 1363 Burroughs Rd
- 29075 Us Highway 10
- 1920 E Shore Dr
- 2008 290th Ave
- 1364 Burroughs Rd
- 1375 S Shore Dr
- 14181 290th Ave
- 1369 S Shore Dr
- 29000 Us Highway 10
- 2012 290th Ave
- 29020 Us Highway 10
- 29020 U S 10
- 1353 Burroughs Rd