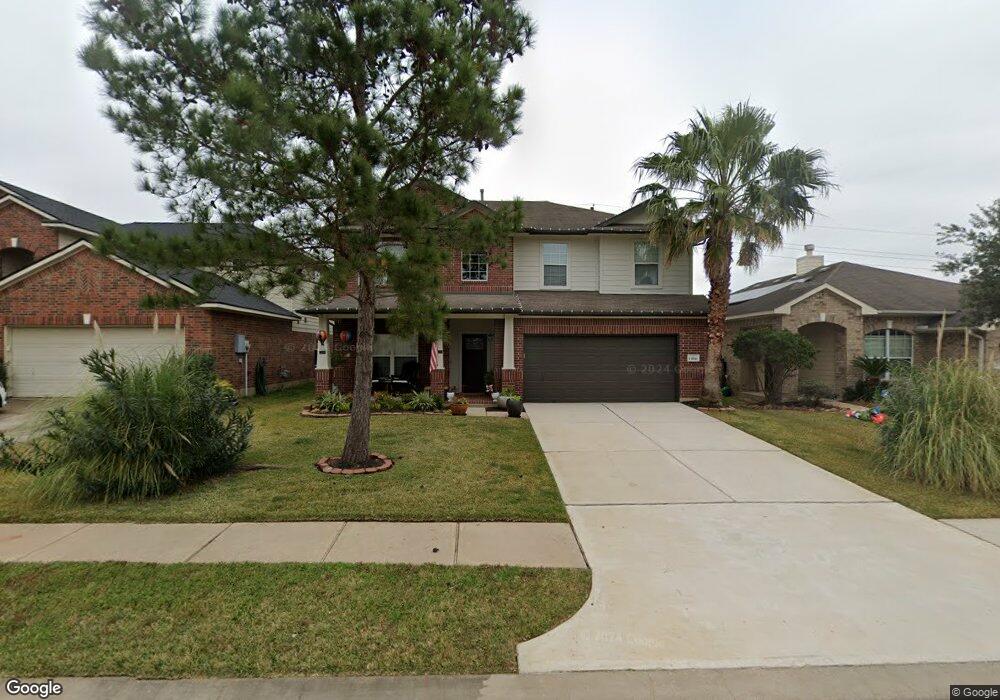
13930 Crow Ridge Ct Cypress, TX 77429
Northpointe NeighborhoodEstimated Value: $374,854 - $402,000
4
Beds
3
Baths
2,980
Sq Ft
$131/Sq Ft
Est. Value
About This Home
This home is located at 13930 Crow Ridge Ct, Cypress, TX 77429 and is currently estimated at $389,214, approximately $130 per square foot. 13930 Crow Ridge Ct is a home located in Harris County with nearby schools including Wildwood Elementary School, Oakcrest Intermediate School, and Tomball Memorial High School.
Ownership History
Date
Name
Owned For
Owner Type
Purchase Details
Closed on
Mar 15, 2013
Sold by
Misurda Nicole Gretchen and Minich Nicole Gretchen
Bought by
Minich Nathan S and Minich Nicole Gretchen
Current Estimated Value
Purchase Details
Closed on
Feb 10, 2010
Sold by
Weaver William W and Weaver Andrea
Bought by
Misurda Nicole Gretchen
Home Financials for this Owner
Home Financials are based on the most recent Mortgage that was taken out on this home.
Original Mortgage
$179,685
Interest Rate
4.87%
Mortgage Type
FHA
Purchase Details
Closed on
Jul 28, 2006
Sold by
Indian Trails Lp
Bought by
Weaver William W and Weaver Andrea
Home Financials for this Owner
Home Financials are based on the most recent Mortgage that was taken out on this home.
Original Mortgage
$26,223
Interest Rate
8.25%
Mortgage Type
Stand Alone Second
Create a Home Valuation Report for This Property
The Home Valuation Report is an in-depth analysis detailing your home's value as well as a comparison with similar homes in the area
Home Values in the Area
Average Home Value in this Area
Purchase History
| Date | Buyer | Sale Price | Title Company |
|---|---|---|---|
| Minich Nathan S | -- | None Available | |
| Misurda Nicole Gretchen | -- | Great American Title | |
| Weaver William W | -- | Premier Title Co |
Source: Public Records
Mortgage History
| Date | Status | Borrower | Loan Amount |
|---|---|---|---|
| Previous Owner | Misurda Nicole Gretchen | $179,685 | |
| Previous Owner | Weaver William W | $26,223 | |
| Previous Owner | Weaver William W | $139,860 |
Source: Public Records
Tax History Compared to Growth
Tax History
| Year | Tax Paid | Tax Assessment Tax Assessment Total Assessment is a certain percentage of the fair market value that is determined by local assessors to be the total taxable value of land and additions on the property. | Land | Improvement |
|---|---|---|---|---|
| 2025 | $7,669 | $404,684 | $55,152 | $349,532 |
| 2024 | $7,669 | $378,915 | $52,842 | $326,073 |
| 2023 | $7,669 | $401,289 | $52,842 | $348,447 |
| 2022 | $8,190 | $346,745 | $44,468 | $302,277 |
| 2021 | $7,716 | $279,917 | $40,425 | $239,492 |
| 2020 | $7,599 | $265,810 | $40,425 | $225,385 |
| 2019 | $7,317 | $248,997 | $30,897 | $218,100 |
| 2018 | $2,601 | $229,073 | $30,897 | $198,176 |
| 2017 | $13,528 | $229,073 | $30,897 | $198,176 |
| 2016 | $6,644 | $225,000 | $30,897 | $194,103 |
| 2015 | $4,884 | $225,000 | $30,897 | $194,103 |
| 2014 | $4,884 | $186,000 | $30,897 | $155,103 |
Source: Public Records
Map
Nearby Homes
- 13939 Windover Park Ln
- 13918 Crow Ridge Ct
- 13823 Pointed Edge Ln
- 14415 Santee Pass Dr
- 13603 Sandford Meadow Ln
- 14030 Blackfoot Trail Run
- 13914 Sedgefield Creek Trace
- 13526 Astley Acres Ln
- 14011 Blackfoot Trail Run
- 14418 Cobalt Bend Trail
- 14616 Grant Rd
- 13423 Astley Acres Ln
- 13507 Marble Pointe Ln
- 14706 Palladio Dr
- 13710 Brahman Valley Ct
- 13330 Cypress Palms Ct
- 13730 Brahman Valley Ct
- 13315 Edison Trace Ln
- 14102 Pawnee Bend Dr
- 13018 Hazelwood Hollow Dr
- 13926 Crow Ridge Ct
- 13934 Crow Ridge Ct
- 13922 Crow Ridge Ct
- 13938 Crow Ridge Ct
- 14003 Windover Park Ln
- 14007 Windover Park Ln
- 13942 Crow Ridge Ct
- 14011 Windover Park Ln
- 13935 Windover Park Ln
- 13931 Crow Ridge Ct
- 13927 Crow Ridge Ct
- 13935 Crow Ridge Ct
- 14015 Windover Park Ln
- 13914 Crow Ridge Ct
- 13923 Crow Ridge Ct
- 13939 Crow Ridge Ct
- 13931 Windover Park Ln
- 13946 Crow Ridge Ct
- 14019 Windover Park Ln
- 13919 Crow Ridge Ct