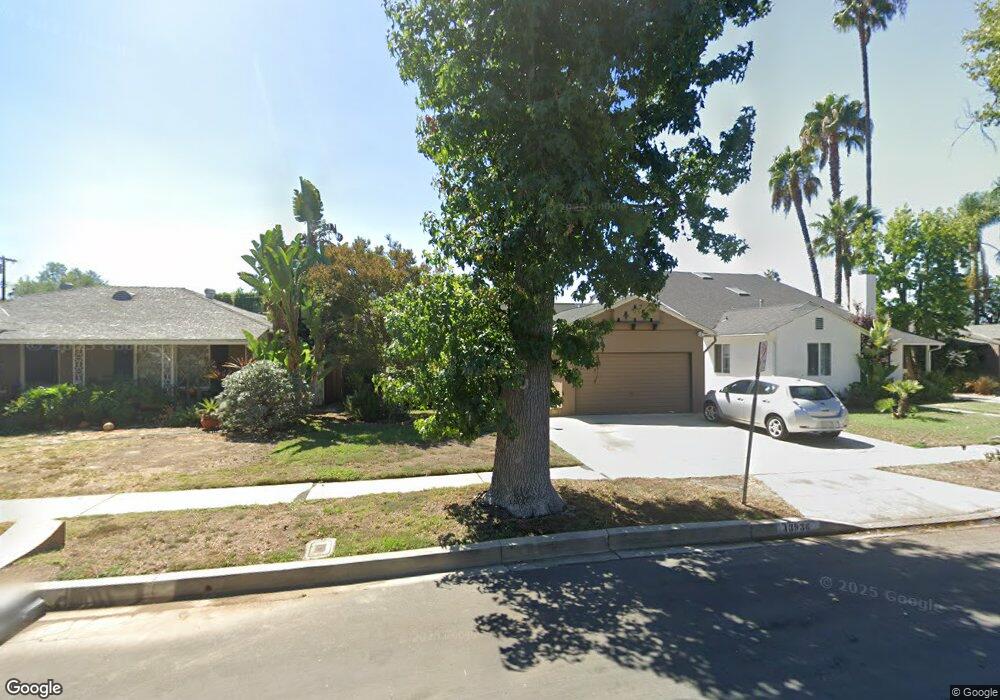
13936 Califa St van Nuys, CA 91401
Estimated Value: $1,191,491 - $1,347,000
3
Beds
2
Baths
1,626
Sq Ft
$772/Sq Ft
Est. Value
About This Home
This home is located at 13936 Califa St, van Nuys, CA 91401 and is currently estimated at $1,255,123, approximately $771 per square foot. 13936 Califa St is a home located in Los Angeles County with nearby schools including Erwin Street Elementary School, Van Nuys High School, and Ararat Charter School.
Ownership History
Date
Name
Owned For
Owner Type
Purchase Details
Closed on
Dec 5, 2015
Sold by
Vincent John E
Bought by
2015 Vincent Family Trust
Current Estimated Value
Purchase Details
Closed on
Sep 21, 2011
Sold by
Shepherd Sherri E and Sherri E Tarpley Separate Prop
Bought by
Vincent John E and Vincent Laurie E
Home Financials for this Owner
Home Financials are based on the most recent Mortgage that was taken out on this home.
Original Mortgage
$364,000
Outstanding Balance
$248,071
Interest Rate
4.16%
Mortgage Type
New Conventional
Estimated Equity
$1,007,052
Purchase Details
Closed on
Oct 29, 2002
Sold by
Shepherd Sherri E
Bought by
Tarpley Jeffrey C
Purchase Details
Closed on
Oct 25, 1999
Sold by
Gerard A Bloch Trust and Ralph
Bought by
Shepherd Sherri
Home Financials for this Owner
Home Financials are based on the most recent Mortgage that was taken out on this home.
Original Mortgage
$266,000
Interest Rate
7.5%
Create a Home Valuation Report for This Property
The Home Valuation Report is an in-depth analysis detailing your home's value as well as a comparison with similar homes in the area
Home Values in the Area
Average Home Value in this Area
Purchase History
| Date | Buyer | Sale Price | Title Company |
|---|---|---|---|
| 2015 Vincent Family Trust | -- | None Available | |
| Vincent John E | $455,000 | Progressive Title | |
| Tarpley Jeffrey C | -- | -- | |
| Shepherd Sherri | $280,000 | Provident Title Company |
Source: Public Records
Mortgage History
| Date | Status | Borrower | Loan Amount |
|---|---|---|---|
| Open | Vincent John E | $364,000 | |
| Previous Owner | Shepherd Sherri | $266,000 |
Source: Public Records
Tax History
| Year | Tax Paid | Tax Assessment Tax Assessment Total Assessment is a certain percentage of the fair market value that is determined by local assessors to be the total taxable value of land and additions on the property. | Land | Improvement |
|---|---|---|---|---|
| 2025 | $7,031 | $571,493 | $427,429 | $144,064 |
| 2024 | $7,031 | $560,289 | $419,049 | $141,240 |
| 2023 | $6,898 | $549,304 | $410,833 | $138,471 |
| 2022 | $6,580 | $538,534 | $402,778 | $135,756 |
| 2021 | $6,496 | $527,976 | $394,881 | $133,095 |
| 2019 | $6,304 | $512,318 | $383,169 | $129,149 |
| 2018 | $6,191 | $502,273 | $375,656 | $126,617 |
| 2016 | $5,910 | $482,771 | $361,070 | $121,701 |
| 2015 | $5,824 | $475,520 | $355,647 | $119,873 |
| 2014 | $5,849 | $466,206 | $348,681 | $117,525 |
Source: Public Records
Map
Nearby Homes
- 5906 Colbath Ave
- 14024 Califa St
- 13942 Oxnard St
- 13822 Oxnard St
- 5750 Stansbury Ave
- 13801 Oxnard St Unit 206
- 14136 Tiara St
- 5744 Stansbury Ave
- 13816 Bessemer St
- 6104 Costello Ave
- 5811 Woodman Ave Unit 22
- 14153 Tiara St
- 5728 Mammoth Ave
- 5654 Stansbury Ave
- 5636 Matilija Ave
- 14043 Calvert St
- 6044 Woodman Ave
- 6121 Woodman Ave
- 14206 Calvert St
- 14216 Calvert St
- 13930 Califa St
- 13940 Califa St
- 13926 Califa St
- 13946 Califa St
- 13937 Emelita St
- 13931 Emelita St
- 13941 Emelita St
- 13920 Califa St
- 5901 Colbath Ave
- 13927 Emelita St
- 13947 Emelita St
- 5848 Costello Ave
- 5856 Costello Ave
- 5842 Costello Ave
- 13916 Califa St
- 13921 Emelita St
- 5900 Costello Ave
- 5909 Colbath Ave
- 13917 Emelita St
- 5906 Costello Ave
Your Personal Tour Guide
Ask me questions while you tour the home.