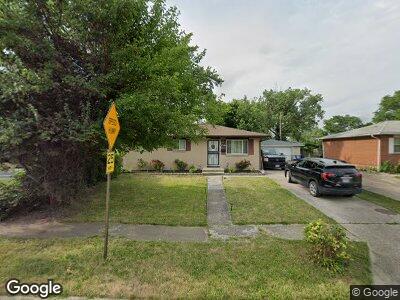
1394 Faber Ave Columbus, OH 43207
Marion Franklin NeighborhoodEstimated Value: $164,850 - $175,000
3
Beds
2
Baths
925
Sq Ft
$184/Sq Ft
Est. Value
About This Home
This home is located at 1394 Faber Ave, Columbus, OH 43207 and is currently estimated at $170,463, approximately $184 per square foot. 1394 Faber Ave is a home located in Franklin County with nearby schools including Watkins Elementary School, Buckeye Middle School, and Marion-Franklin High School.
Ownership History
Date
Name
Owned For
Owner Type
Purchase Details
Closed on
Oct 15, 2024
Sold by
Nrea Vb Iii Llc
Bought by
Vb Eleven Llc
Current Estimated Value
Purchase Details
Closed on
Jan 20, 2016
Sold by
Financially Free Enterprises Llc
Bought by
Vinebrook Annex B Ohio Llc
Purchase Details
Closed on
Oct 17, 2012
Sold by
Raul Repino Properties Llc
Bought by
Financially Free Investments Llc
Purchase Details
Closed on
Jun 18, 2012
Sold by
Steward Edward
Bought by
Raul Pepino Properties Llc
Home Financials for this Owner
Home Financials are based on the most recent Mortgage that was taken out on this home.
Original Mortgage
$23,000
Interest Rate
3.87%
Mortgage Type
Purchase Money Mortgage
Purchase Details
Closed on
Nov 6, 2009
Sold by
Russell Joe L and Russell Joyce
Bought by
Steward Edward
Purchase Details
Closed on
Oct 19, 1977
Bought by
Russell Joe L and Russell Joyce
Create a Home Valuation Report for This Property
The Home Valuation Report is an in-depth analysis detailing your home's value as well as a comparison with similar homes in the area
Home Values in the Area
Average Home Value in this Area
Purchase History
| Date | Buyer | Sale Price | Title Company |
|---|---|---|---|
| Vb Eleven Llc | $10,660,000 | Os National | |
| Vb Eleven Llc | $10,660,000 | Os National | |
| Vinebrook Annex B Ohio Llc | $65,000 | Stonebridge Land Title | |
| Financially Free Investments Llc | $54,900 | None Available | |
| Raul Pepino Properties Llc | $15,000 | None Available | |
| Steward Edward | $25,500 | Fati | |
| Russell Joe L | -- | -- |
Source: Public Records
Mortgage History
| Date | Status | Borrower | Loan Amount |
|---|---|---|---|
| Previous Owner | Raul Pepino Properties Llc | $23,000 | |
| Previous Owner | Russell Joe L | $68,678 |
Source: Public Records
Tax History Compared to Growth
Tax History
| Year | Tax Paid | Tax Assessment Tax Assessment Total Assessment is a certain percentage of the fair market value that is determined by local assessors to be the total taxable value of land and additions on the property. | Land | Improvement |
|---|---|---|---|---|
| 2024 | $2,281 | $49,770 | $13,510 | $36,260 |
| 2023 | $2,252 | $49,770 | $13,510 | $36,260 |
| 2022 | $1,230 | $23,140 | $8,300 | $14,840 |
| 2021 | $1,473 | $23,140 | $8,300 | $14,840 |
| 2020 | $1,349 | $23,140 | $8,300 | $14,840 |
| 2019 | $1,221 | $19,640 | $7,210 | $12,430 |
| 2018 | $1,239 | $19,640 | $7,210 | $12,430 |
| 2017 | $1,335 | $19,640 | $7,210 | $12,430 |
| 2016 | $1,366 | $20,100 | $3,610 | $16,490 |
| 2015 | $1,212 | $20,100 | $3,610 | $16,490 |
| 2014 | $1,246 | $20,100 | $3,610 | $16,490 |
| 2013 | $751 | $23,625 | $4,235 | $19,390 |
Source: Public Records
Map
Nearby Homes
- 1325 Evergreen Rd
- 1364 Wick Ct
- 2882 Fairwood Ave
- 1305 Yolanda Dr
- 3087 Woodway Rd
- 1621 Burley Dr
- 3037 Southfield Dr
- 1336 Southfield Dr S
- 1292 Moundview Ave
- 1565 Southfield Dr S
- 3199 Fairwood Ave
- 1473 Venice Dr
- 757 Lawndale Ave
- 1146 Lawrence Dr
- 2181 Bellevue Ave
- 3551 Groveport Rd
- 574 Koebel Ave
- 0 Elwood Ave Unit Lot 108 225014603
- 0 Elwood Ave Unit Lot 8 225014595
- 572 Elwood Ave Unit Lot 113
- 1394 Faber Ave
- 1386 Faber Ave
- 1402 Faber Ave
- 1380 Faber Ave
- 1410 Faber Ave
- 1395 Benvue Dr
- 1387 Benvue Dr
- 1405 Benvue Dr
- 1374 Faber Ave
- 1381 Benvue Dr
- 1413 Benvue Dr
- 1393 Faber Ave
- 1387 Faber Ave
- 1418 Faber Ave
- 2747 Fairwood Ave
- 1368 Faber Ave
- 1379 Faber Ave
- 1373 Benvue Dr
- 2741 Fairwood Ave
- 1373 Faber Ave