
Estimated payment $2,274/month
Total Views
704
2
Beds
1
Bath
1,350
Sq Ft
$278
Price per Sq Ft
Highlights
- Mature Trees
- Rambler Architecture
- Corner Lot
- Mountain View
- Wood Flooring
- No HOA
About This Home
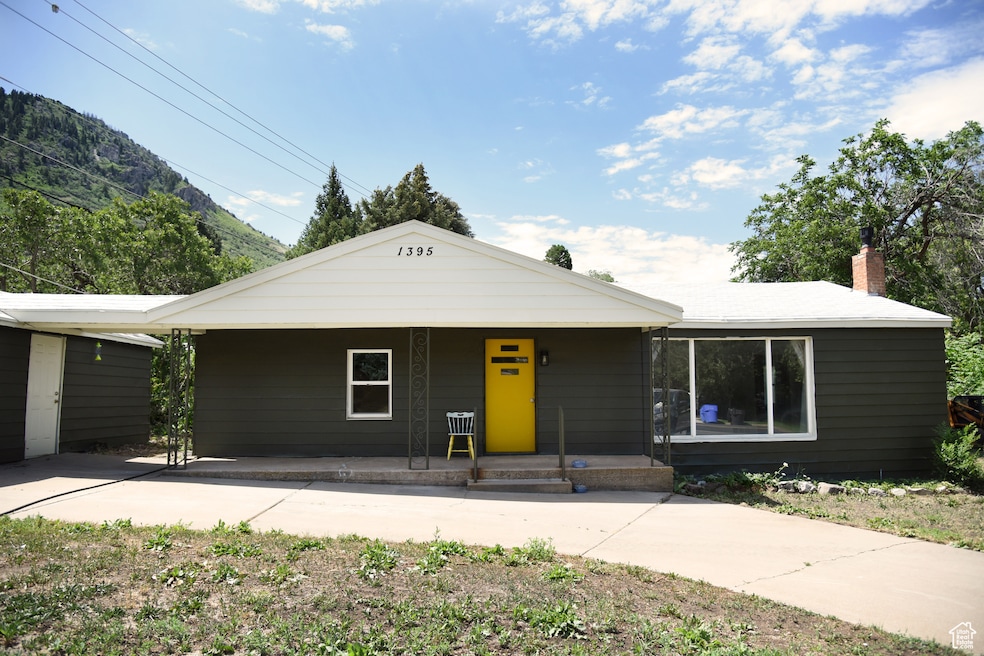
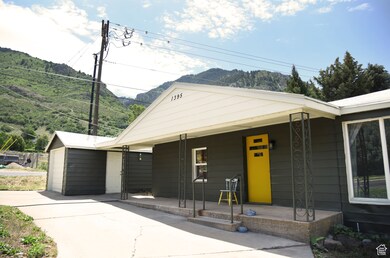
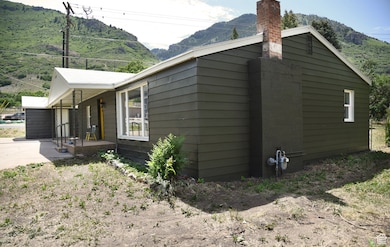
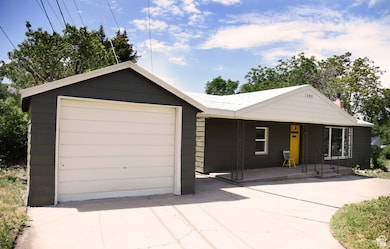
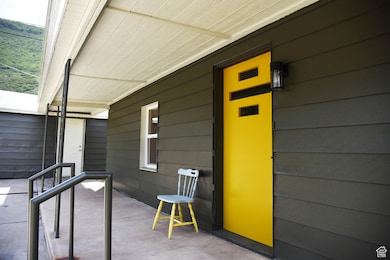
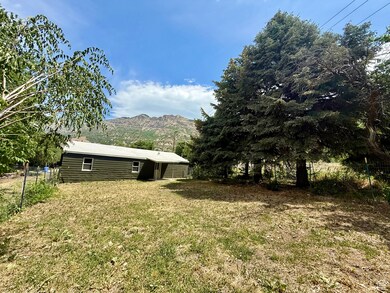
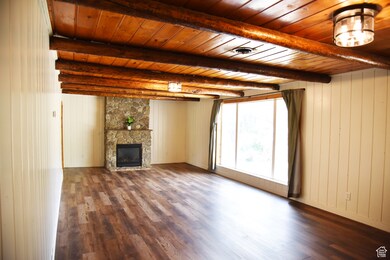
**Multiple Offers Received** This charming 2-bedroom, 1-bathroom single level home sits on a spacious half acre located right on the mountain in North Ogden. Just down the street from the North Ogden divide, with stunning views and mature trees- this is prime location! Step inside to find a cozy living space complete with a large family room, natural stone gas fireplace, fresh paint, newer windows, upgraded lighting throughout, original hardwood floors, unique timber ceilings throughout, and an extra-large- beautifully updated bathroom. This property also features an aluminum roof that will last a lifetime, fresh exterior paint and brand-new furnace and thermostat! The mature trees, peaceful surroundings and generous yard create a serene outdoor setting with endless potential. Already approved and zoned for an ADU, this property offers a rare opportunity. Whether you're starting out, downsizing, or investing this home checks all the boxes. Enjoy the best of mountain living in a prime location- quiet, scenic, and still close to everything North Ogden has to offer. Please include pre-qual letter or proof of funds with all offers.
Listing Agent
Ashley Montoya
RE/MAX Associates License #8293717 Listed on: 06/13/2025
Home Details
Home Type
- Single Family
Est. Annual Taxes
- $2,436
Year Built
- Built in 1946
Lot Details
- 0.51 Acre Lot
- Partially Fenced Property
- Landscaped
- Corner Lot
- Mature Trees
Parking
- 1 Car Garage
Home Design
- Rambler Architecture
- Aluminum Roof
- Metal Siding
Interior Spaces
- 1,350 Sq Ft Home
- 1-Story Property
- Self Contained Fireplace Unit Or Insert
- Wood Flooring
- Mountain Views
- Electric Dryer Hookup
Bedrooms and Bathrooms
- 2 Main Level Bedrooms
- 1 Full Bathroom
Eco-Friendly Details
- Reclaimed Water Irrigation System
Outdoor Features
- Outbuilding
- Porch
Schools
- Bates Elementary School
- North Ogden Middle School
- Weber High School
Utilities
- Forced Air Heating and Cooling System
- Natural Gas Connected
Community Details
- No Home Owners Association
Listing and Financial Details
- Assessor Parcel Number 17-084-0008
Map
Create a Home Valuation Report for This Property
The Home Valuation Report is an in-depth analysis detailing your home's value as well as a comparison with similar homes in the area
Home Values in the Area
Average Home Value in this Area
Tax History
| Year | Tax Paid | Tax Assessment Tax Assessment Total Assessment is a certain percentage of the fair market value that is determined by local assessors to be the total taxable value of land and additions on the property. | Land | Improvement |
|---|---|---|---|---|
| 2024 | $2,437 | $349,999 | $135,718 | $214,281 |
| 2023 | $2,523 | $373,000 | $135,289 | $237,711 |
| 2022 | $2,353 | $357,000 | $135,289 | $221,711 |
| 2021 | $1,900 | $266,000 | $64,007 | $201,993 |
| 2020 | $1,734 | $225,000 | $53,006 | $171,994 |
| 2019 | $1,681 | $209,000 | $47,883 | $161,117 |
| 2018 | $1,647 | $196,000 | $47,883 | $148,117 |
| 2017 | $1,506 | $167,000 | $47,820 | $119,180 |
| 2016 | $1,339 | $78,693 | $26,589 | $52,104 |
| 2015 | $1,183 | $68,145 | $29,376 | $38,769 |
| 2014 | $1,202 | $68,144 | $29,376 | $38,768 |
Source: Public Records
Property History
| Date | Event | Price | Change | Sq Ft Price |
|---|---|---|---|---|
| 06/17/2025 06/17/25 | Pending | -- | -- | -- |
| 06/13/2025 06/13/25 | For Sale | $375,000 | -- | $278 / Sq Ft |
Source: UtahRealEstate.com
Purchase History
| Date | Type | Sale Price | Title Company |
|---|---|---|---|
| Warranty Deed | -- | First American Title | |
| Quit Claim Deed | -- | None Available | |
| Warranty Deed | -- | Hickman Land Title Co | |
| Interfamily Deed Transfer | -- | Hickman Land Title Co | |
| Interfamily Deed Transfer | -- | None Available |
Source: Public Records
Mortgage History
| Date | Status | Loan Amount | Loan Type |
|---|---|---|---|
| Previous Owner | $93,000 | New Conventional |
Source: Public Records
Similar Homes in the area
Source: UtahRealEstate.com
MLS Number: 2092071
APN: 17-084-0008
Disclaimer: Certain information contained herein is derived from information provided by parties other than Homes.com. All information provided is deemed reliable, but is not guaranteed to be accurate and should be independently verified.
![]() IDX information is provided exclusively for consumers’ personal, non-commercial use, that it may not be used for any purpose other than to identify prospective properties consumers may be interested in purchasing, and that the data is deemed reliable but is not guaranteed accurate by the MLS. Licensor is only providing the MLS Content and not other sources of data provided in the Product.
IDX information is provided exclusively for consumers’ personal, non-commercial use, that it may not be used for any purpose other than to identify prospective properties consumers may be interested in purchasing, and that the data is deemed reliable but is not guaranteed accurate by the MLS. Licensor is only providing the MLS Content and not other sources of data provided in the Product.
Based on information from the Wasatch Front Regional Multiple Listing Service, Inc.. All data, including all measurements and calculations of area, is obtained from various sources and has not been, and will not be, verified by broker or the MLS. All information should be independently reviewed and verified for accuracy. Properties may or may not be listed by the office/agent presenting the information.
Nearby Homes
- 2540 N Mountain Rd
- 1345 E 2750 N
- 2558 N 1150 E
- 1164 E 2650 N
- 2838 N 1375 E
- 1075 E 2600 N
- 2876 N 1300 E
- 2747 N 1050 E
- 2974 N 1375 E
- 2859 N 1175 E
- 2444 950 E
- 1272 E 2925 N
- 1260 E 2925 N
- 2997 N 1350 E
- 2908 Cherry Dr
- 3023 N Mountain Rd Unit 212
- 3033 N Mountain Rd Unit 211
- 2865 N 1050 E
- 967 E 2800 N
- 1443 E 3090 N Unit 305