Estimated Value: $225,000 - $280,000
4
Beds
2
Baths
1,820
Sq Ft
$141/Sq Ft
Est. Value
About This Home
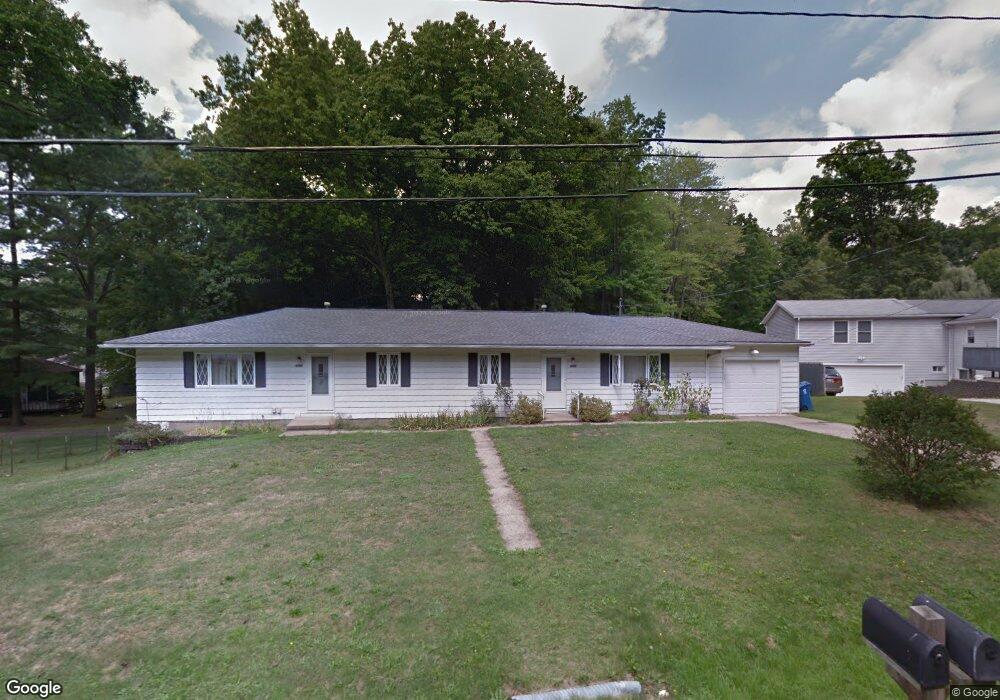
This home is located at 1395 Mctaggart Rd Unit 1397, Stow, OH 44224 and is currently estimated at $255,797, approximately $140 per square foot. 1395 Mctaggart Rd Unit 1397 is a home located in Summit County with nearby schools including Stow-Munroe Falls High School, Primrose School of Hudson, and Holy Family Elementary School.
Ownership History
Date
Name
Owned For
Owner Type
Purchase Details
Closed on
Aug 5, 2024
Sold by
Hobbs Harlynn Joseph Milton
Bought by
Hjmh Properties Llc
Current Estimated Value
Purchase Details
Closed on
Apr 21, 2011
Sold by
Hobbs Harlynn J M and Hobbs Harlynn Joseph Milton
Bought by
Hobbs Harlynn Joseph Milton and The Harlynn J M Hobbs Revocable Trust
Purchase Details
Closed on
Jun 20, 2002
Sold by
Shuman Jean Bee
Bought by
Hobbs Harlynn J M
Home Financials for this Owner
Home Financials are based on the most recent Mortgage that was taken out on this home.
Original Mortgage
$131,480
Interest Rate
6.87%
Mortgage Type
Purchase Money Mortgage
Purchase Details
Closed on
Jul 8, 1999
Sold by
Shuman Jean Bee
Bought by
Shuman Jean Bee and The Jean Bee Shuman Trust
Create a Home Valuation Report for This Property
The Home Valuation Report is an in-depth analysis detailing your home's value as well as a comparison with similar homes in the area
Home Values in the Area
Average Home Value in this Area
Purchase History
| Date | Buyer | Sale Price | Title Company |
|---|---|---|---|
| Hjmh Properties Llc | -- | Miller Examining Service | |
| Hobbs Harlynn Joseph Milton | -- | None Available | |
| Hobbs Harlynn J M | $138,400 | Miller Examining Service Inc | |
| Shuman Jean Bee | -- | -- |
Source: Public Records
Mortgage History
| Date | Status | Borrower | Loan Amount |
|---|---|---|---|
| Previous Owner | Hobbs Harlynn J M | $131,480 |
Source: Public Records
Tax History Compared to Growth
Tax History
| Year | Tax Paid | Tax Assessment Tax Assessment Total Assessment is a certain percentage of the fair market value that is determined by local assessors to be the total taxable value of land and additions on the property. | Land | Improvement |
|---|---|---|---|---|
| 2025 | $3,738 | $65,083 | $12,604 | $52,479 |
| 2024 | $3,738 | $65,083 | $12,604 | $52,479 |
| 2023 | $3,738 | $65,083 | $12,604 | $52,479 |
| 2022 | $3,477 | $53,414 | $10,248 | $43,166 |
| 2021 | $3,120 | $53,414 | $10,248 | $43,166 |
| 2020 | $3,068 | $53,420 | $10,250 | $43,170 |
| 2019 | $2,862 | $46,550 | $13,500 | $33,050 |
| 2018 | $2,816 | $46,550 | $13,500 | $33,050 |
| 2017 | $2,739 | $46,550 | $13,500 | $33,050 |
| 2016 | $2,854 | $43,980 | $13,500 | $30,480 |
| 2015 | $2,739 | $43,980 | $13,500 | $30,480 |
| 2014 | $2,742 | $43,980 | $13,500 | $30,480 |
| 2013 | $2,605 | $42,000 | $13,500 | $28,500 |
Source: Public Records
Map
Nearby Homes
- 1470 Mac Dr
- 0 Hibbard Dr
- V/L Lawnmark Dr
- 4891 Cedar Crest Ln
- 4877 Cedar Crest Ln
- 1664 Cypress Ct
- 1808 Higby Dr Unit A
- 1511 Apollo Dr
- 1627 Cypress Ct
- 1938 Higby Dr
- 1620 Sapphire Dr
- 4630 Red Willow Rd
- 1884 Village Ct Unit X66
- V/L Housley Rd
- V/L Norton Rd
- 5217 Beckett Ridge
- 2327 Crockett Cir
- 0 Stow Rd Unit 5102979
- 2380 Port Williams Dr Unit 2380
- 734 Barlow Rd
- 1385 Mctaggart Rd Unit 1387
- 1345 Mac Dr
- 1387 Mctaggart Rd
- 1412 Mctaggart Rd
- 1419 Mctaggart Rd
- 1408 Mctaggart Rd Unit 1412
- 1381 Mac Dr
- 1422 Mctaggart Rd
- 1418 Mctaggart Rd Unit 1422
- 1343 Mac Dr
- 1368 Mac Dr
- 1428 Mctaggart Rd
- 1429 Mctaggart Rd
- 1391 Mac Dr
- 0 Mac Dr Unit 4458259
- 1333 Mac Dr
- 1350 Mac Dr
- 1350 Mac Dr
- 1350 Mac Dr
- 1350 Mac Dr