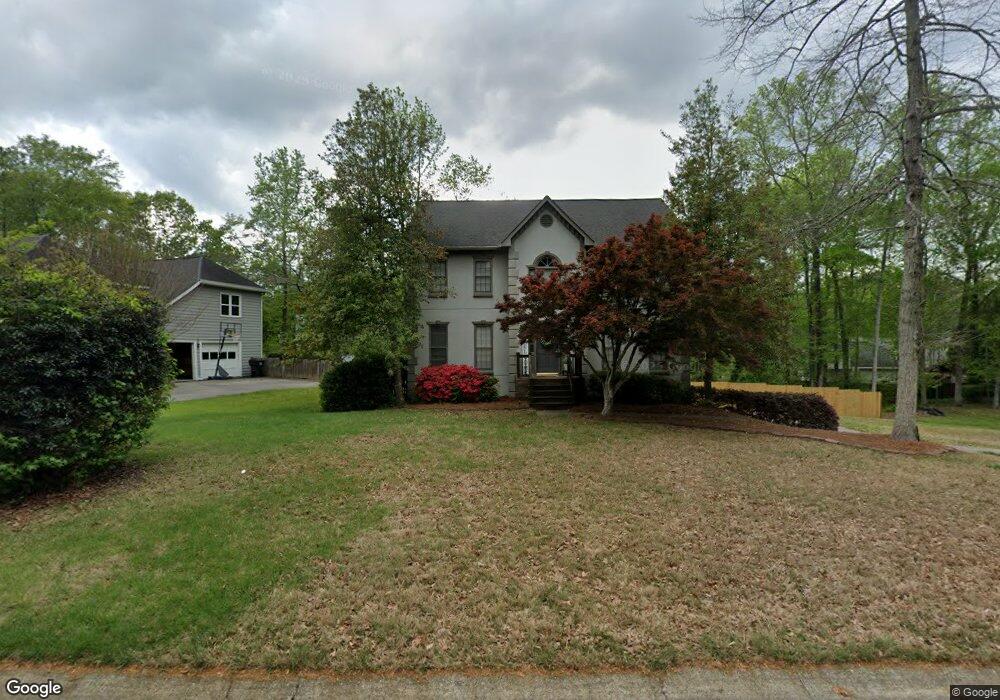
1395 Wynford Gate SW Unit 2 Marietta, GA 30064
West Cobb NeighborhoodEstimated Value: $446,000 - $456,416
4
Beds
3
Baths
2,274
Sq Ft
$198/Sq Ft
Est. Value
About This Home
This home is located at 1395 Wynford Gate SW Unit 2, Marietta, GA 30064 and is currently estimated at $449,604, approximately $197 per square foot. 1395 Wynford Gate SW Unit 2 is a home located in Cobb County with nearby schools including Dowell Elementary School, Lovinggood Middle School, and Hillgrove High School.
Ownership History
Date
Name
Owned For
Owner Type
Purchase Details
Closed on
Dec 19, 2016
Sold by
Antonio Federick G and Antonio Deonna
Bought by
Marton Elizabeth and Marton Michael
Current Estimated Value
Home Financials for this Owner
Home Financials are based on the most recent Mortgage that was taken out on this home.
Original Mortgage
$243,016
Outstanding Balance
$199,025
Interest Rate
3.99%
Mortgage Type
FHA
Estimated Equity
$250,579
Purchase Details
Closed on
Jun 30, 2011
Sold by
Alfaya Fernando
Bought by
Antonio Federick G and Antonio Deonna
Home Financials for this Owner
Home Financials are based on the most recent Mortgage that was taken out on this home.
Original Mortgage
$160,817
Interest Rate
4.37%
Mortgage Type
FHA
Purchase Details
Closed on
Nov 30, 2000
Sold by
Ferencie Steven H and Ferencie Karen L
Bought by
Alfaya Fernando
Home Financials for this Owner
Home Financials are based on the most recent Mortgage that was taken out on this home.
Original Mortgage
$136,000
Interest Rate
7.82%
Mortgage Type
New Conventional
Create a Home Valuation Report for This Property
The Home Valuation Report is an in-depth analysis detailing your home's value as well as a comparison with similar homes in the area
Home Values in the Area
Average Home Value in this Area
Purchase History
| Date | Buyer | Sale Price | Title Company |
|---|---|---|---|
| Marton Elizabeth | $247,500 | -- | |
| Antonio Federick G | $165,000 | -- | |
| Alfaya Fernando | $170,000 | -- |
Source: Public Records
Mortgage History
| Date | Status | Borrower | Loan Amount |
|---|---|---|---|
| Open | Marton Elizabeth | $243,016 | |
| Previous Owner | Antonio Federick G | $160,817 | |
| Previous Owner | Alfaya Fernando | $136,000 |
Source: Public Records
Tax History Compared to Growth
Tax History
| Year | Tax Paid | Tax Assessment Tax Assessment Total Assessment is a certain percentage of the fair market value that is determined by local assessors to be the total taxable value of land and additions on the property. | Land | Improvement |
|---|---|---|---|---|
| 2024 | $4,125 | $170,136 | $34,000 | $136,136 |
| 2023 | $3,102 | $148,012 | $34,000 | $114,012 |
| 2022 | $2,850 | $110,452 | $26,000 | $84,452 |
| 2021 | $2,816 | $108,884 | $21,600 | $87,284 |
| 2020 | $2,400 | $89,904 | $21,600 | $68,304 |
| 2019 | $2,400 | $89,904 | $21,600 | $68,304 |
| 2018 | $2,400 | $89,904 | $21,600 | $68,304 |
| 2017 | $2,142 | $83,440 | $21,600 | $61,840 |
| 2016 | $2,399 | $83,440 | $21,600 | $61,840 |
| 2015 | $2,027 | $68,792 | $21,660 | $47,132 |
| 2014 | $2,044 | $68,792 | $0 | $0 |
Source: Public Records
Map
Nearby Homes
- 2866 Wynford Dr SW Unit 2
- 3006 Coffman Ct SW
- 1234 Wynford Colony SW
- 1567 Vine Leaf Dr
- 1237 Wynford Woods SW
- 1518 Sage Ridge Dr
- 1204 Commonwealth Ave SW
- 3416 N Cook Rd
- 1765 Dew Place
- 719 Crossroad SW
- 1209 Wilkes Way SW Unit 1
- 1004 Villa Rica Rd SW
- 950 Steadman Terrace SW
- 3057 Hallman Cir SW
- 3001 Ashland Ct SW
- 3061 Hallman Cir SW
- 946 Steadman Terrace SW
- 1524 Jade Cove Dr
- 3354 Hannah Ct
- 1397 Wynford SW
- 1397 Wynford Gate SW Unit 2
- 1393 Wynford Gate SW Unit 2
- 1286 Wynford Colony SW
- 1284 Wynford Colony SW
- 1288 Wynford Colony SW Unit 2
- 1396 Wynford Gate SW Unit 2
- 1394 Wynford Gate SW
- 0 Wynford Gate South W Unit 9051639
- 0 Wynford Gate South W Unit 3221179
- 0 Wynford Gate South W Unit 7146239
- 1391 Wynford Gate SW Unit 2
- 3108 Wynford Gables SW
- 1290 Wynford Colony SW Unit 2
- 1400 Wynford Gate SW
- 1282 Wynford Colony SW
- 1392 Wynford Gate SW
- 1389 Wynford Gate SW
- 1292 Wynford Colony SW
- 3104 Wynford Gables SW