Estimated Value: $957,146 - $1,019,000
3
Beds
2
Baths
1,623
Sq Ft
$605/Sq Ft
Est. Value
About This Home
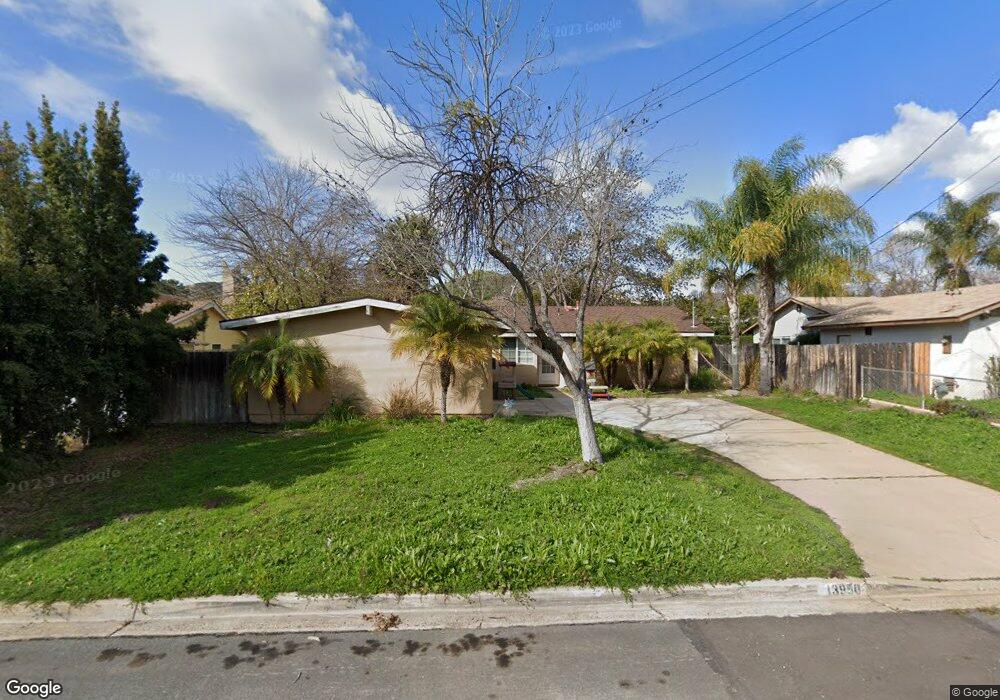
This home is located at 13950 Powers Rd, Poway, CA 92064 and is currently estimated at $981,537, approximately $604 per square foot. 13950 Powers Rd is a home located in San Diego County with nearby schools including Pomerado Elementary, Meadowbrook Middle, and Poway High.
Ownership History
Date
Name
Owned For
Owner Type
Purchase Details
Closed on
Jul 27, 2012
Sold by
Rhew Brian A
Bought by
Rhew Brian A and Rhew Christine S
Current Estimated Value
Home Financials for this Owner
Home Financials are based on the most recent Mortgage that was taken out on this home.
Original Mortgage
$139,000
Outstanding Balance
$96,066
Interest Rate
3.62%
Mortgage Type
New Conventional
Estimated Equity
$885,471
Purchase Details
Closed on
Apr 27, 1999
Sold by
Walsh Family Trust 06-25-97 and Arthur A
Bought by
Rhew Brian A
Home Financials for this Owner
Home Financials are based on the most recent Mortgage that was taken out on this home.
Original Mortgage
$156,150
Interest Rate
6.86%
Purchase Details
Closed on
Jun 25, 1997
Sold by
Walsh Arthur A and Walsh Vivian E
Bought by
Walsh Arthur A and Walsh Vivian E
Create a Home Valuation Report for This Property
The Home Valuation Report is an in-depth analysis detailing your home's value as well as a comparison with similar homes in the area
Home Values in the Area
Average Home Value in this Area
Purchase History
| Date | Buyer | Sale Price | Title Company |
|---|---|---|---|
| Rhew Brian A | -- | Lawyers Title Company | |
| Rhew Brian A | $173,500 | Chicago Title Insurance Co | |
| Walsh Arthur A | -- | -- |
Source: Public Records
Mortgage History
| Date | Status | Borrower | Loan Amount |
|---|---|---|---|
| Open | Rhew Brian A | $139,000 | |
| Closed | Rhew Brian A | $156,150 |
Source: Public Records
Tax History
| Year | Tax Paid | Tax Assessment Tax Assessment Total Assessment is a certain percentage of the fair market value that is determined by local assessors to be the total taxable value of land and additions on the property. | Land | Improvement |
|---|---|---|---|---|
| 2025 | $3,943 | $349,619 | $156,761 | $192,858 |
| 2024 | $3,943 | $342,765 | $153,688 | $189,077 |
| 2023 | $3,860 | $336,045 | $150,675 | $185,370 |
| 2022 | $3,797 | $329,457 | $147,721 | $181,736 |
| 2021 | $3,748 | $322,998 | $144,825 | $178,173 |
| 2020 | $3,699 | $319,687 | $143,340 | $176,347 |
| 2019 | $3,605 | $313,420 | $140,530 | $172,890 |
| 2018 | $3,505 | $307,275 | $137,775 | $169,500 |
| 2017 | $3,413 | $301,251 | $135,074 | $166,177 |
| 2016 | $3,344 | $295,345 | $132,426 | $162,919 |
| 2015 | $3,295 | $290,909 | $130,437 | $160,472 |
| 2014 | $3,220 | $285,211 | $127,882 | $157,329 |
Source: Public Records
Map
Nearby Homes
- 12311 Witt Rd
- 13824 Powers Rd
- 14109 Arbolitos Dr
- 13641 Carriage Rd
- 13442 Mountainside Dr
- 12124 Riley Ln
- 12614 Orohaven Ln
- 12739 Papago Dr
- 14138 Brent Wilsey Place Unit 3
- 14110 Brent Wilsey Place Unit 1
- 12450 Robison Blvd
- 12939 Cree Ct
- 13254 Powers Ct
- 12885 Rockwell Ct
- 12851 Papago Dr
- 12719 Robison Blvd Unit 18
- 11908 Tivoli Park Row Unit 7
- 13847 Carmel Ridge Rd Unit 1
- 14613 Plumwood St
- 13957 Carmel Ridge Rd
- 13956 Powers Rd
- 13944 Powers Rd
- 0 E Pomerado Rd Unit OC16751496
- 0 E Pomerado Rd Unit 160062239
- 14000 Powers Rd
- 13938 Powers Rd
- 13957 Powers Rd
- 13945 Powers Rd
- 14006 Powers Rd
- 14003 Halper Rd
- 13932 Powers Rd
- 14001 Powers Rd
- 13939 Powers Rd
- 14009 Halper Rd
- 13933 Powers Rd
- 14007 Powers Rd
- 14015 Halper Rd
- 14012 Powers Rd
- 13926 Powers Rd
- 13952 Frame Rd
Your Personal Tour Guide
Ask me questions while you tour the home.