Estimated Value: $1,520,000 - $2,145,000
8
Beds
4
Baths
6,181
Sq Ft
$296/Sq Ft
Est. Value
About This Home
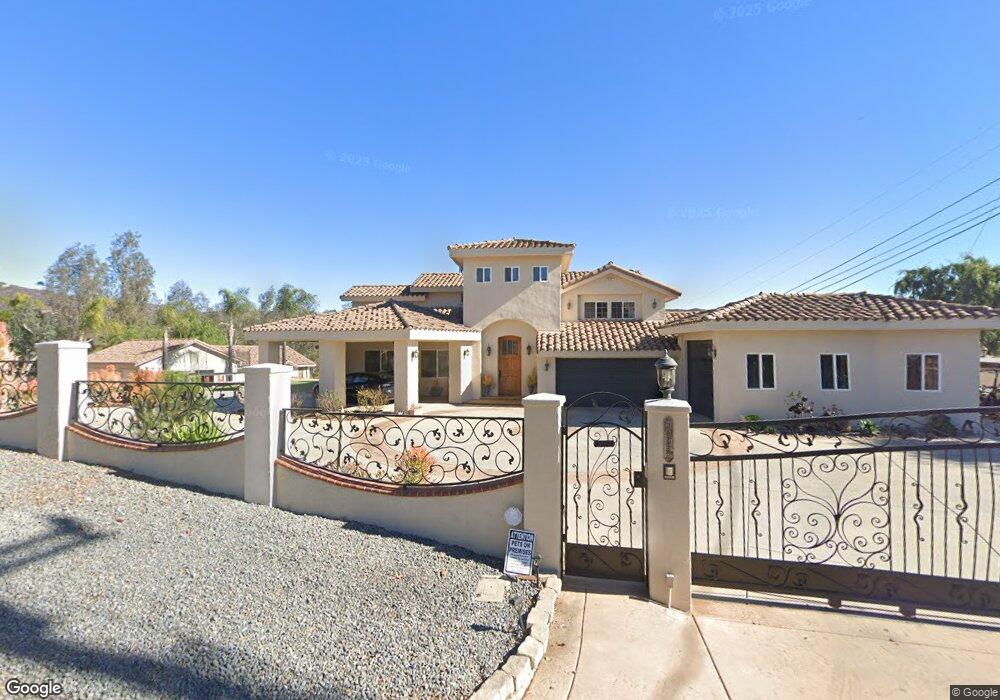
This home is located at 13950 Via de Jamul, Jamul, CA 91935 and is currently estimated at $1,831,931, approximately $296 per square foot. 13950 Via de Jamul is a home located in San Diego County with nearby schools including Jamul Primary School, Oak Grove Middle School, and Valhalla High.
Ownership History
Date
Name
Owned For
Owner Type
Purchase Details
Closed on
May 16, 2015
Sold by
Redford Kim
Bought by
Monroe Jeffrey W and Monroe Melanie B
Current Estimated Value
Home Financials for this Owner
Home Financials are based on the most recent Mortgage that was taken out on this home.
Original Mortgage
$999,200
Interest Rate
3.62%
Mortgage Type
Adjustable Rate Mortgage/ARM
Purchase Details
Closed on
Jun 6, 2013
Sold by
Tyler Kim R
Bought by
Tyler Kim R
Purchase Details
Closed on
May 28, 2013
Sold by
Tyler Kelly D and Tyler Kim R
Bought by
Tyler Kim R
Purchase Details
Closed on
Feb 12, 2003
Sold by
Tyler Kelly D and Tyler Kim M
Bought by
Tyler Kelly D and Tyler Kim M
Purchase Details
Closed on
Mar 17, 1993
Create a Home Valuation Report for This Property
The Home Valuation Report is an in-depth analysis detailing your home's value as well as a comparison with similar homes in the area
Home Values in the Area
Average Home Value in this Area
Purchase History
| Date | Buyer | Sale Price | Title Company |
|---|---|---|---|
| Monroe Jeffrey W | $1,249,000 | Chicago Title | |
| Tyler Kim R | -- | None Available | |
| Tyler Kim R | -- | None Available | |
| Tyler Kelly D | -- | None Available | |
| Tyler Kelly D | -- | -- | |
| -- | $325,000 | -- |
Source: Public Records
Mortgage History
| Date | Status | Borrower | Loan Amount |
|---|---|---|---|
| Previous Owner | Monroe Jeffrey W | $999,200 |
Source: Public Records
Tax History Compared to Growth
Tax History
| Year | Tax Paid | Tax Assessment Tax Assessment Total Assessment is a certain percentage of the fair market value that is determined by local assessors to be the total taxable value of land and additions on the property. | Land | Improvement |
|---|---|---|---|---|
| 2025 | $17,520 | $1,478,555 | $331,459 | $1,147,096 |
| 2024 | $17,520 | $1,449,564 | $324,960 | $1,124,604 |
| 2023 | $17,199 | $1,421,142 | $318,589 | $1,102,553 |
| 2022 | $16,787 | $1,393,278 | $312,343 | $1,080,935 |
| 2021 | $16,437 | $1,365,960 | $306,219 | $1,059,741 |
| 2020 | $16,352 | $1,351,955 | $303,080 | $1,048,875 |
| 2019 | $16,209 | $1,325,447 | $297,138 | $1,028,309 |
| 2018 | $15,924 | $1,299,459 | $291,312 | $1,008,147 |
| 2017 | $15,602 | $1,273,980 | $285,600 | $988,380 |
| 2016 | $15,291 | $1,249,000 | $280,000 | $969,000 |
| 2015 | $12,217 | $988,448 | $150,569 | $837,879 |
| 2014 | $11,651 | $969,087 | $147,620 | $821,467 |
Source: Public Records
Map
Nearby Homes
- 0 Reservoir Unit 1 250035987
- 3195 Calle de Oro
- 15223 Presilla Dr
- 00087 Presilla Dr Unit 87
- Lot 85 Presilla Dr
- Lot 84 Presilla Dr
- 14085 Proctor Valley Rd
- 13838 Campo Rd Unit 3
- 13838 Campo Rd Unit 8
- 14694 Chaparral Slope Rd
- 0 Jamul Highlands Rd
- 89 Yacoo Ct Unit 89
- 2732 Vista Del Piedra
- LOT 88 Presilla Dr
- 13829 Whispering Meadows Ln
- 13925 Illerongis Rd
- 00 Skyline Truck Trail Unit 1
- Montiel Truck Trails End Dr
- 14650 Alkosh Rd
- 13585 Vista Sage Ln Unit 16
- 13940 Via de Jamul
- 14322 Hillside Dr
- 13949 Via de Jamul
- 13921 Via de Jamul
- 13840 Via de Jamul
- 10 10 Hillside Dr
- 10 Hillside Dr
- 13911 Via de Jamul
- 13915 Via de Jamul
- 14236 Hillside Dr Lot 2 Unit 2
- 14347 Hillside Dr
- 13909 Via de Jamul
- 14236 Hillside Dr
- 13812 Via de Jamul
- 14213 Hillside Dr
- 13913 Via de Jamul
- 14216 Hillside Dr
- 13905 Via de Jamul
- 13903 Via de Jamul
- 14154 Hillside Dr