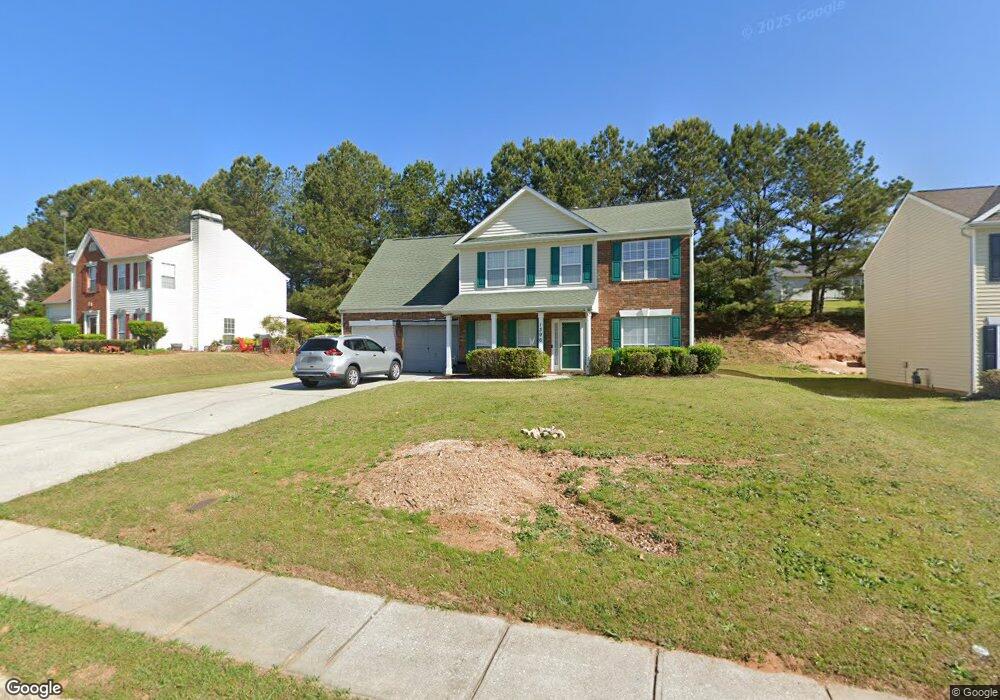
1396 Leicster Ct Unit 5 Hampton, GA 30228
Estimated Value: $244,733 - $277,000
3
Beds
3
Baths
1,784
Sq Ft
$148/Sq Ft
Est. Value
About This Home
This home is located at 1396 Leicster Ct Unit 5, Hampton, GA 30228 and is currently estimated at $264,683, approximately $148 per square foot. 1396 Leicster Ct Unit 5 is a home located in Clayton County with nearby schools including Kemp Primary School, Kemp Elementary School, and Lovejoy Middle School.
Ownership History
Date
Name
Owned For
Owner Type
Purchase Details
Closed on
Jul 2, 2019
Sold by
Gilpin Robert M
Bought by
Gilpin Alicia P
Current Estimated Value
Home Financials for this Owner
Home Financials are based on the most recent Mortgage that was taken out on this home.
Original Mortgage
$81,400
Outstanding Balance
$51,954
Interest Rate
3.82%
Mortgage Type
New Conventional
Estimated Equity
$212,729
Purchase Details
Closed on
Jun 13, 2019
Sold by
Gilpin Alicia P
Bought by
Gilpin Robert
Home Financials for this Owner
Home Financials are based on the most recent Mortgage that was taken out on this home.
Original Mortgage
$81,400
Outstanding Balance
$51,954
Interest Rate
3.82%
Mortgage Type
New Conventional
Estimated Equity
$212,729
Purchase Details
Closed on
Nov 5, 1998
Sold by
Horton-Torrey D R
Bought by
Gilpin Robert M
Home Financials for this Owner
Home Financials are based on the most recent Mortgage that was taken out on this home.
Original Mortgage
$124,250
Interest Rate
6.47%
Mortgage Type
New Conventional
Create a Home Valuation Report for This Property
The Home Valuation Report is an in-depth analysis detailing your home's value as well as a comparison with similar homes in the area
Home Values in the Area
Average Home Value in this Area
Purchase History
| Date | Buyer | Sale Price | Title Company |
|---|---|---|---|
| Gilpin Alicia P | $80,000 | -- | |
| Gilpin Robert | -- | -- | |
| Gilpin Robert M | $124,300 | -- |
Source: Public Records
Mortgage History
| Date | Status | Borrower | Loan Amount |
|---|---|---|---|
| Open | Gilpin Alicia P | $81,400 | |
| Previous Owner | Gilpin Robert M | $124,250 |
Source: Public Records
Tax History Compared to Growth
Tax History
| Year | Tax Paid | Tax Assessment Tax Assessment Total Assessment is a certain percentage of the fair market value that is determined by local assessors to be the total taxable value of land and additions on the property. | Land | Improvement |
|---|---|---|---|---|
| 2024 | $3,441 | $97,240 | $8,800 | $88,440 |
| 2023 | $3,394 | $94,000 | $8,800 | $85,200 |
| 2022 | $2,875 | $82,280 | $8,800 | $73,480 |
| 2021 | $2,209 | $64,960 | $8,800 | $56,160 |
| 2020 | $1,902 | $56,613 | $8,800 | $47,813 |
| 2019 | $1,730 | $51,685 | $6,400 | $45,285 |
| 2018 | $1,441 | $44,560 | $6,400 | $38,160 |
| 2017 | $1,129 | $36,816 | $6,400 | $30,416 |
| 2016 | $1,162 | $37,624 | $6,400 | $31,224 |
| 2015 | $1,157 | $0 | $0 | $0 |
| 2014 | $587 | $23,772 | $6,400 | $17,372 |
Source: Public Records
Map
Nearby Homes
- 10897 Paladin Dr
- 10859 Panhandle Rd
- 10571 Starling Trail Unit II
- 10725 Barberry Dr Unit 5
- 10617 Barberry Dr
- 1350 Birdsong Ln
- 1438 Starling Ct
- 10779 Tara Village Way
- 1278 Lynx Ct
- 1435 Trellis Ct Unit (LOT 8)
- 1447 Trellis Ct Unit (LOT 6)
- 10553 Eagle Dr
- 1432 Shadow Creek Ave
- 10413 Trellis Ln Unit (LOT 33)
- 10429 Trellis Ln
- 10413 Trellis Ln
- 10425 Trellis Ln
- 10425 Trellis Ln Unit (LOT 30)
- 10429 Trellis Ln Unit (LOT 29)
- 1590 Flicker Rd
- 1406 Leicster Ct
- 1388 Leicster Ct Unit V
- 1405 Hyde Ct
- 1414 Leicster Ct
- 1380 Leicster Ct
- 0 Leicster Ct Unit 7377144
- 0 Leicster Ct Unit 7025852
- 0 Leicster Ct Unit 7612163
- 0 Leicster Ct Unit 8316536
- 1411 Hyde Ct
- 1401 Leicster Ct
- 1399 Hyde Ct Unit V
- 1409 Leicster Ct
- 1393 Leicster Ct
- 1419 Hyde Ct Unit V
- 1422 Leicster Ct
- 1417 Leicster Ct
- 1372 Leicster Ct Unit 7
- 1385 Leicster Ct Unit 5, Lot
- 1385 Leicster Ct