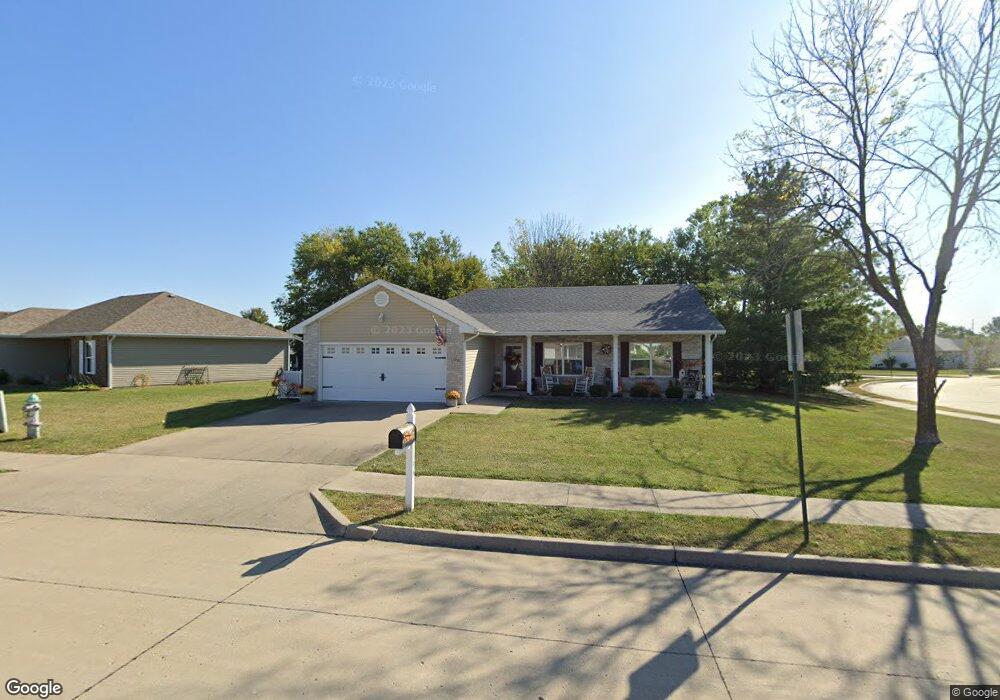
1396 Matthew St Fulton, MO 65251
Estimated Value: $222,636 - $265,000
--
Bed
--
Bath
1,250
Sq Ft
$194/Sq Ft
Est. Value
About This Home
This home is located at 1396 Matthew St, Fulton, MO 65251 and is currently estimated at $241,909, approximately $193 per square foot. 1396 Matthew St is a home located in Callaway County with nearby schools including Fulton Senior High School, Kingdom Christian Academy, and St. Peter Catholic School.
Ownership History
Date
Name
Owned For
Owner Type
Purchase Details
Closed on
Oct 21, 2019
Sold by
Easley Justin M and Easley Amanda E
Bought by
Jones Judith A
Current Estimated Value
Home Financials for this Owner
Home Financials are based on the most recent Mortgage that was taken out on this home.
Original Mortgage
$75,000
Outstanding Balance
$65,970
Interest Rate
3.7%
Mortgage Type
New Conventional
Estimated Equity
$175,939
Purchase Details
Closed on
Feb 11, 2019
Sold by
Bill Chiles Construction
Bought by
Easley Justin M and Easley Amanda E
Home Financials for this Owner
Home Financials are based on the most recent Mortgage that was taken out on this home.
Original Mortgage
$333,561
Interest Rate
4.4%
Mortgage Type
Undefined Multiple Amounts
Purchase Details
Closed on
Dec 3, 2010
Sold by
Zweifel Daniel W and Estate Of Wayne R Zweifel
Bought by
Easley Austin M and Easley Amanda E
Home Financials for this Owner
Home Financials are based on the most recent Mortgage that was taken out on this home.
Original Mortgage
$105,262
Interest Rate
4.37%
Mortgage Type
FHA
Create a Home Valuation Report for This Property
The Home Valuation Report is an in-depth analysis detailing your home's value as well as a comparison with similar homes in the area
Home Values in the Area
Average Home Value in this Area
Purchase History
| Date | Buyer | Sale Price | Title Company |
|---|---|---|---|
| Jones Judith A | -- | -- | |
| Easley Justin M | -- | -- | |
| Easley Austin M | -- | None Available |
Source: Public Records
Mortgage History
| Date | Status | Borrower | Loan Amount |
|---|---|---|---|
| Open | Jones Judith A | $75,000 | |
| Previous Owner | Easley Justin M | $333,561 | |
| Previous Owner | Easley Austin M | $105,262 |
Source: Public Records
Tax History Compared to Growth
Tax History
| Year | Tax Paid | Tax Assessment Tax Assessment Total Assessment is a certain percentage of the fair market value that is determined by local assessors to be the total taxable value of land and additions on the property. | Land | Improvement |
|---|---|---|---|---|
| 2024 | $1,433 | $23,169 | $0 | $0 |
| 2023 | $1,433 | $22,694 | $0 | $0 |
| 2022 | $1,397 | $22,694 | $3,800 | $18,894 |
| 2021 | $1,395 | $22,694 | $3,800 | $18,894 |
| 2020 | $1,415 | $22,694 | $3,800 | $18,894 |
| 2019 | $1,369 | $22,694 | $3,800 | $18,894 |
| 2018 | $1,416 | $22,694 | $3,800 | $18,894 |
| 2017 | $1,259 | $22,694 | $3,800 | $18,894 |
| 2016 | $1,220 | $21,070 | $0 | $0 |
| 2015 | $1,192 | $21,070 | $0 | $0 |
| 2014 | -- | $21,070 | $0 | $0 |
Source: Public Records
Map
Nearby Homes
- 1394 Matthew St
- 691 Sheri Ln
- 690 Gregory Ln
- 585 Gregory Ln
- 1392 Matthew St
- 590 Gregory Ln
- 1395 Matthew St
- 586 Gregory Ln
- 1393 Matthew St
- 1401 Gregory Ln
- 1390 Matthew St
- 1391 Matthew St
- 1402 Gregory Ln
- 1391 Erik Place
- 1389 Erik Place
- 580 Gregory Ln
- 1396 Jessica Ln
- 1394 Jessica Ln
- 1387 Erik Place
- 1405 Gregory Ln